We released Top 1000 Chinese Apps ranked by MAU in July 2016 to offer a multi-dimensional sketch of the mobile internet landscape in China. This time, we go further to unveil the Top 2000 Chinese Apps to give you a panoramic view of mobile devices, user portrait, app performance, and more.
Here in our exclusive Autumn 2016 Review, you will find virtually everything you need to know about China’s mobile internet space.
1. Smart Devices and Apps: An Overview
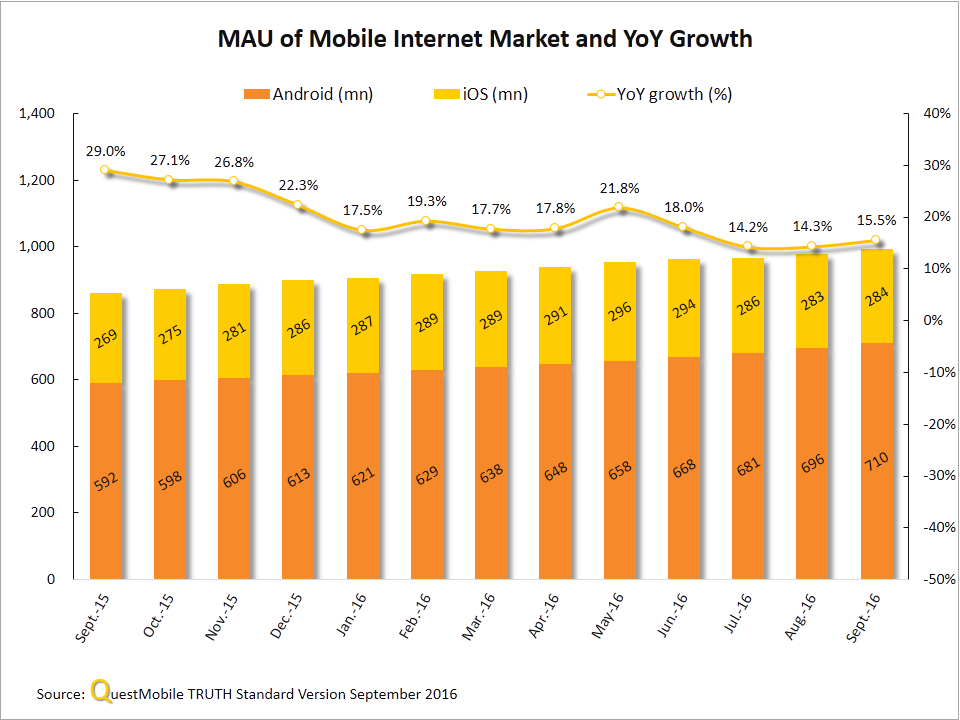
1)About 1000 Million MAU in September
According to the data released by QuestMobile, MAU of China’s mobile internet market has approached 1 billion as of September 2016, among which Android and iOS exceeded 700 and 280 million respectively.
Despite slowing growth, the size of the mobile market in China increased considerably during the past few months. And what this 1 billion user base would bring is hard to predict.
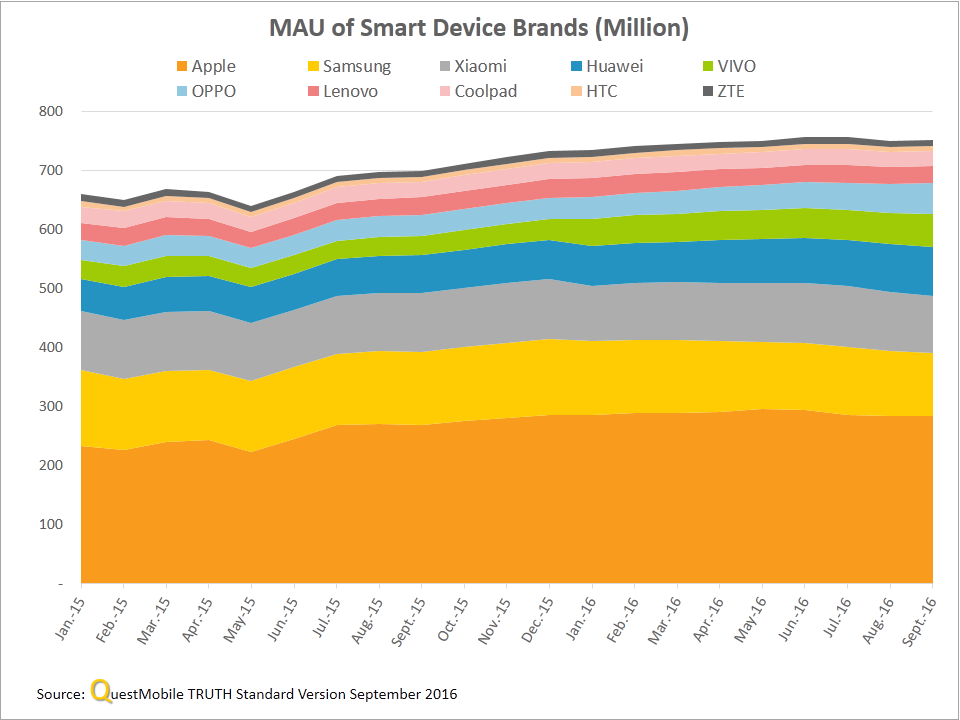
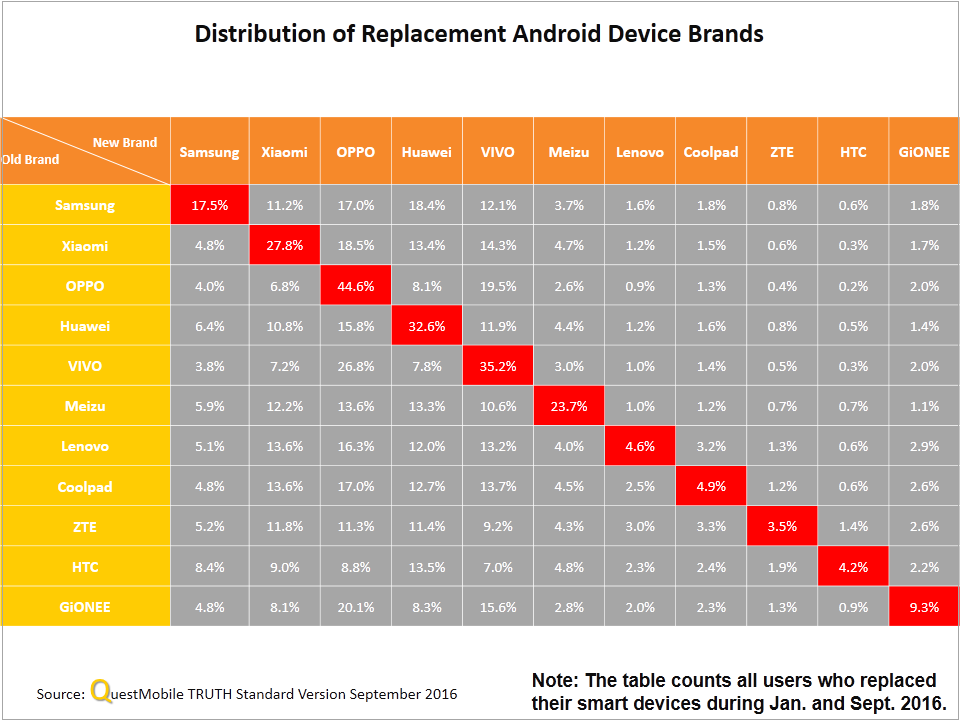
2)MAU of Smart Device Brands
On the whole, iPhone maintained steady MAU growth while Samsung and Xiaomi saw slightly declining MAU. In addition, MAU of Huawei, VIVO and OPPO increased rapidly.
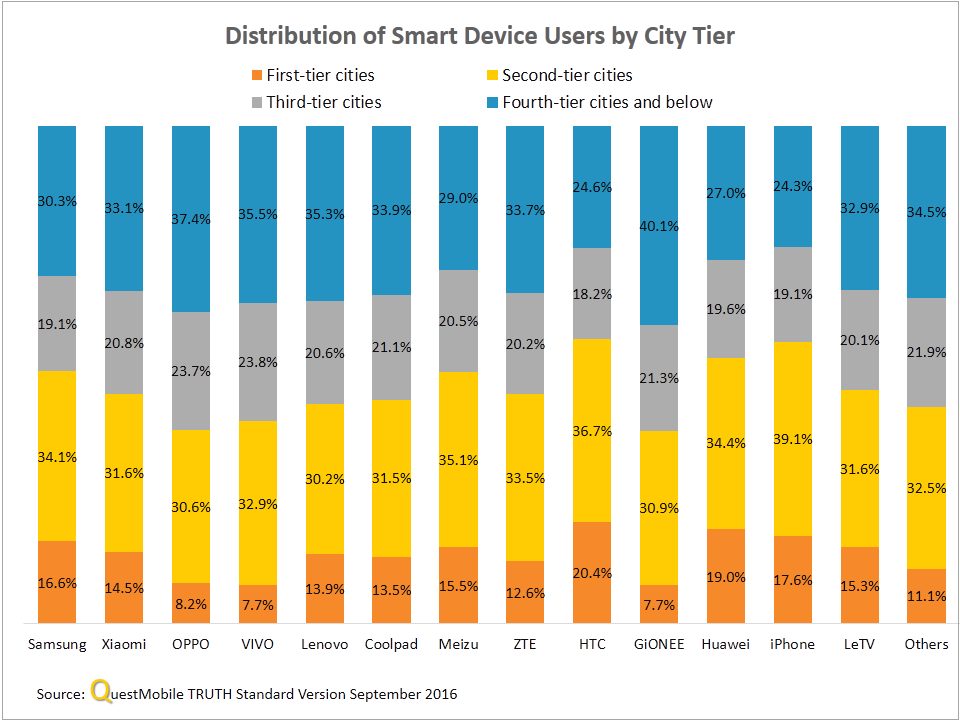
3)User Distribution by City Tier
In general, OPPO and VIVO enjoyed a distinct market advantage in tier 2, 3, and 4 cities, especially third and fourth tier cities. Among all brands, HTC had the highest share of users from first-tier cities. This also has something to do with its substantially shrinking market share.
Huawei and iPhone performed particularly well in first and second tier cities. One thing to note is that Huawei had a similar city-tier distribution to iPhone, implying it fiercely competes with its arch-rival in the Chinese market.
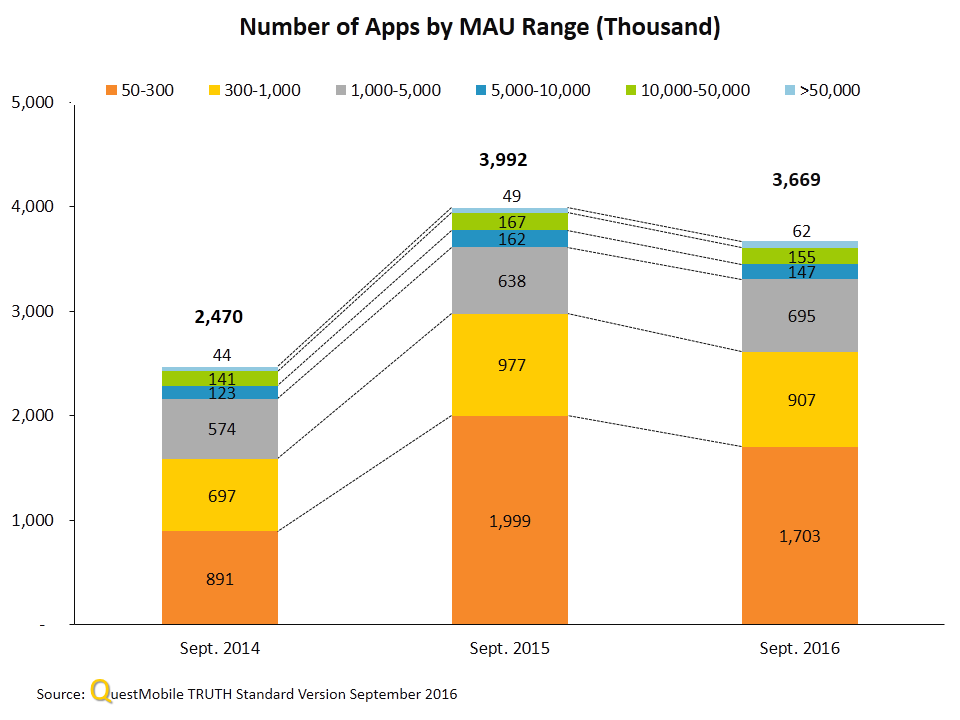
4)Number of Apps by MAU Range
The chart below shows subtle changes in the Chinese app market from 2014 to 2016, that is, rapid growth followed by a slow decline.
It is noteworthy that from Sept. 2015 to Sept. 2016, the number of apps with MAU ranging from 1 to 5 million and exceeding 50 million was still on constant rise. By contrast, the number of apps in other MAU ranges all dropped to varying degrees.
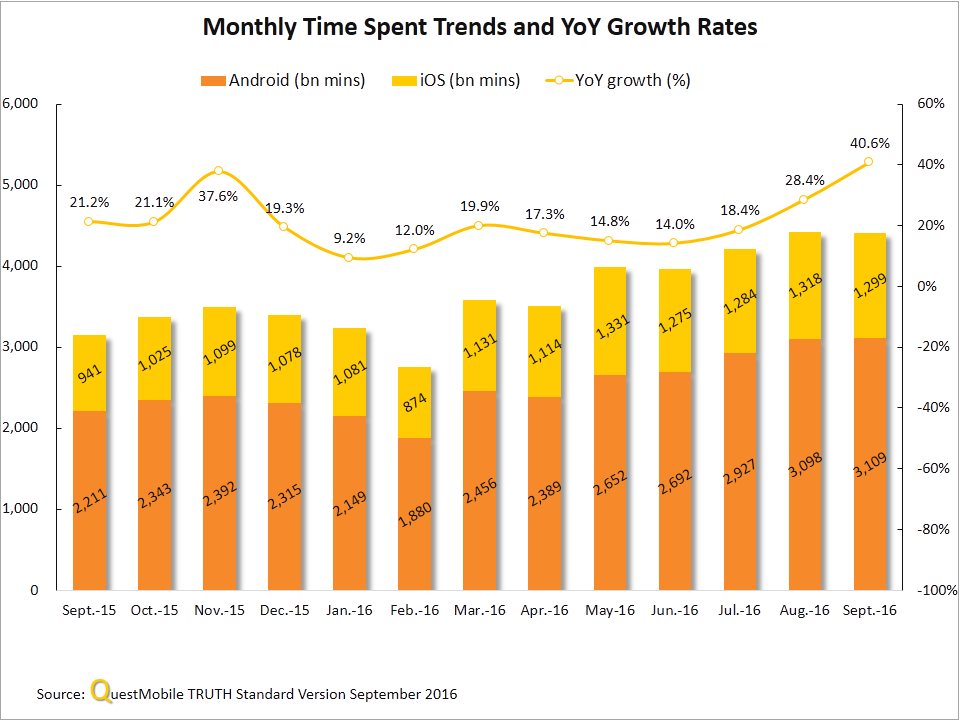
5)Monthly Time Spent Trends and Share
QuestMobile’s data shows that total time spent on Android apps per month had been growing rapidly from Sept. 2015 to Sept. 2016 (except in Feb. 2016 when time spent declined due to the Chinese New Year). On the other hand, total time spent on iOS apps per month had been fluctuating during the same period. Specifically, monthly time spent on WeChat continued to grow robustly whereas that on QQ was decreasing.


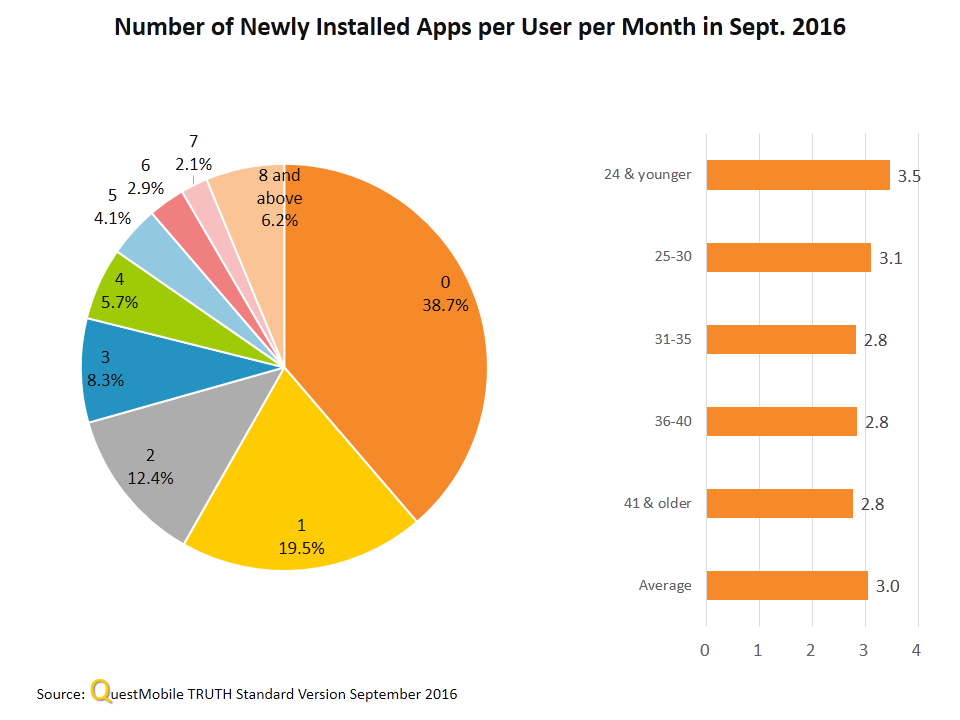
6)Newly Installed Apps per User per Month and Channel Distribution
The pie chart below shows that nearly 40% of users did not install any apps in September 2016 and about 20% of users installed only one and 2-3 apps respectively in the same month. In other words, around 80% of users basically would not install new apps. In addition, the average number of newly installed apps per user per month was 3, which was mainly driven by users under the age of 24. This is clearly bad news for the market.
Let’s now take a brief look at the performance of app stores in terms of downloads and installs in September 2016. Apart from Apple’s App Store, channels with downloads and installs exceeding 100 million include Yingyongbao, Baidu Mobile Assistant, 360 Mobile Assistant, Huawei App Store, Xiaomi Market, OPPO App Store, and VIVO App Store.
As for conversion rate of new installs, device manufacturers’ app stores generally outperformed third-party app stores. For instance, the conversion rate of new installs of Huawei App Store reached up to 91%.

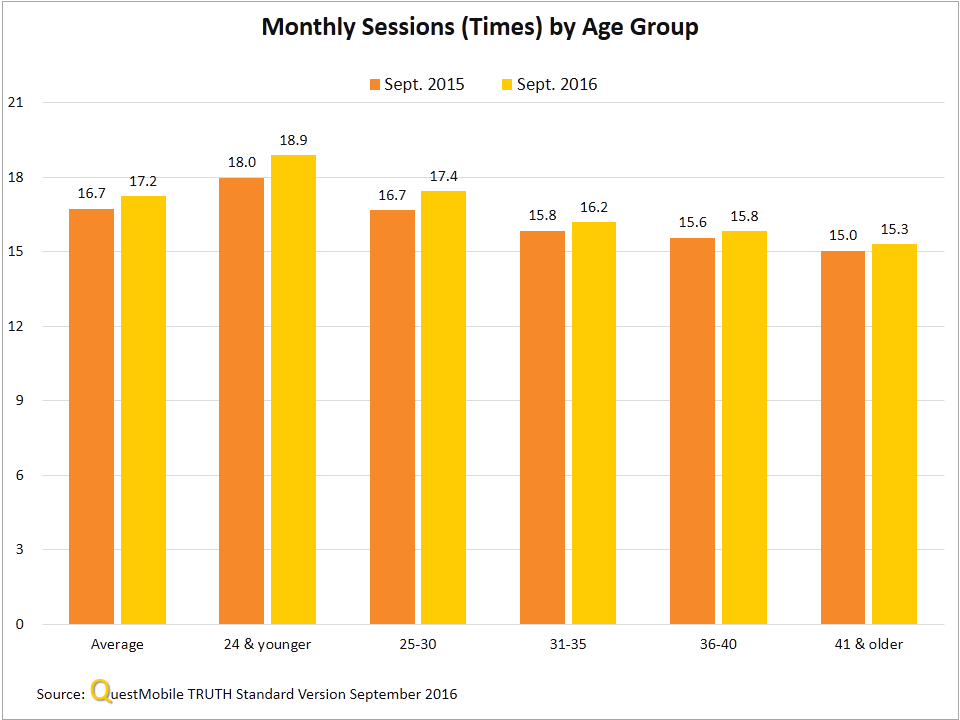
7)Monthly Sessions by Age Group
Average monthly sessions increased from 16.7 times in September 2015 to 17.2 times in September 2016. Again, users under the age of 24 drove up the average as their monthly sessions grew from 18 times to 18.9 times in Sept. 2016. In contrast, monthly sessions of users in other age groups were all below the average except those aged 25 to 30 whose monthly sessions were basically on par with the average. The older users got, the less frequent they opened the apps.
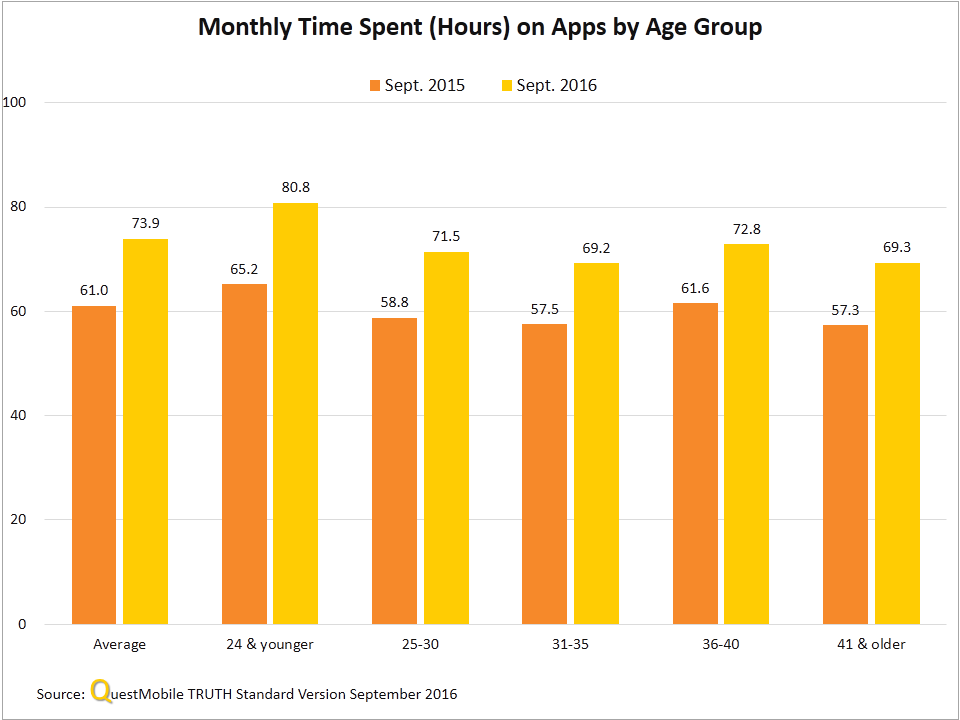
8)Monthly Time Spent on Apps by Age Group
Monthly time spent trends were generally consistent with monthly session trends. Specifically, from Sept. 2015 to Sept. 2016, average monthly time spent on apps increased from 61 hours (equal to 2 hours per day) to 73.9 hours (equal to 2.5 hours per day).
2. App Electrocardiogram and Highlights
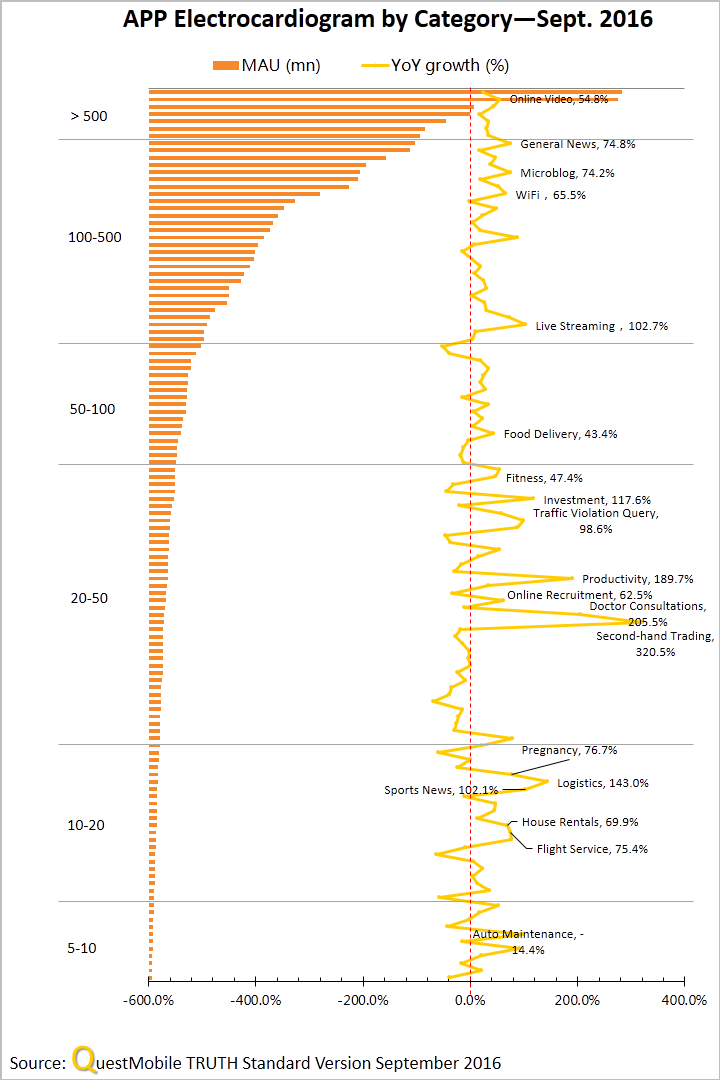
1)App Electrocardiogram by Category
Among app categories with MAU over 5 million, 7 categories saw over 100% YoY MAU growth in Sept. 2016. This compares to 26 categories in our Mid-year Report, which indicates a market cool-down.
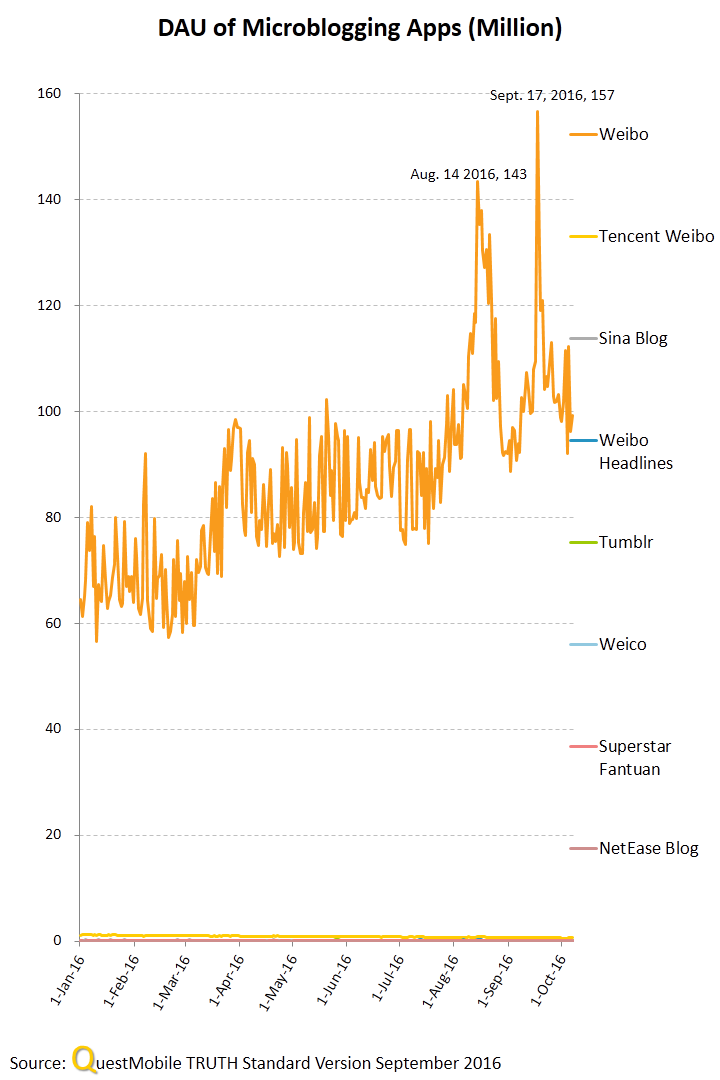
2)Microblog
Now let’s take a look at microblogging apps, Weibo in particular.
Triggered by hot social events like Olympic Games, Weibo usually sees several peaks in DAU each year. For instance, its DAU topped 140 million on Aug. 14 and Sept. 17, 2016 respectively. While a celebrity divorce is behind the first peak, the second peak attributes to nationwide commemoration of the “Sept. 18 Incident".
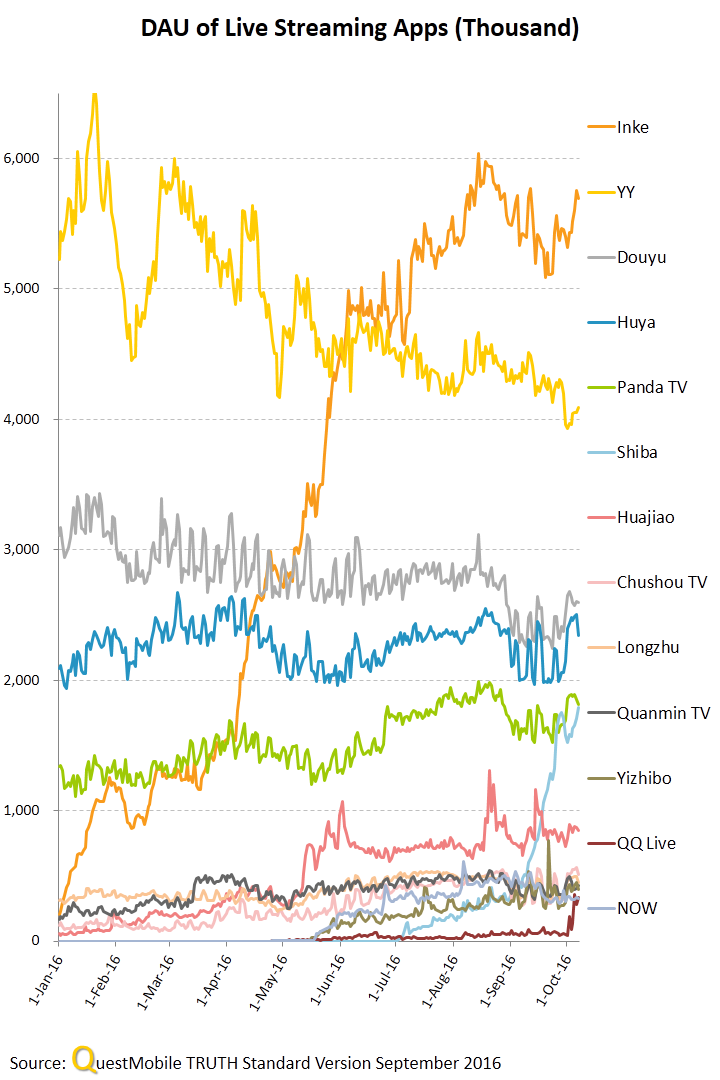
3)Live Streaming
Live streaming market flourished in the first half of 2016 in China. The business has just started a new round of cash-burning and attracted hundreds of players to rush into the rapidly growing space. The DAU of YY is currently on a seemingly unstoppable downward trend. Inke, in comparison, sees its DAU skyrocketing to overtake YY’s. It now ranks first by DAU which currently ranges from 5 to 6 million. In addition, Douyu, Huya and Panda TV maintained comparatively stable DAU growth.
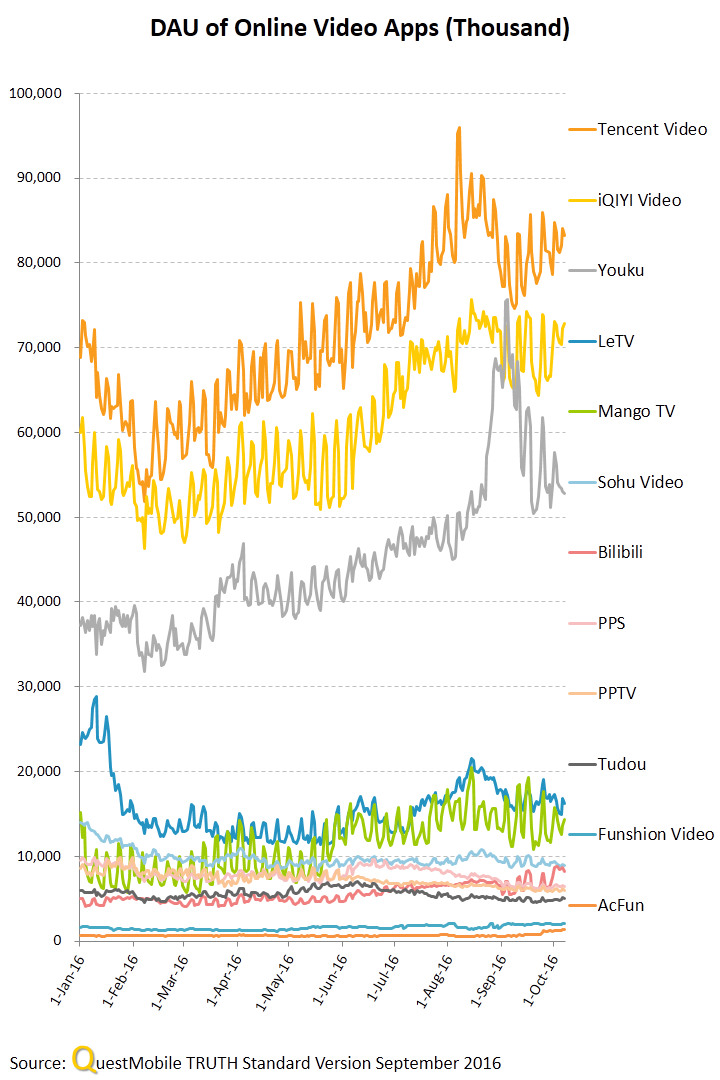
4)Online Video
Despite robust DAU growth, this niche market is unprofitable compared with the booming live streaming market.
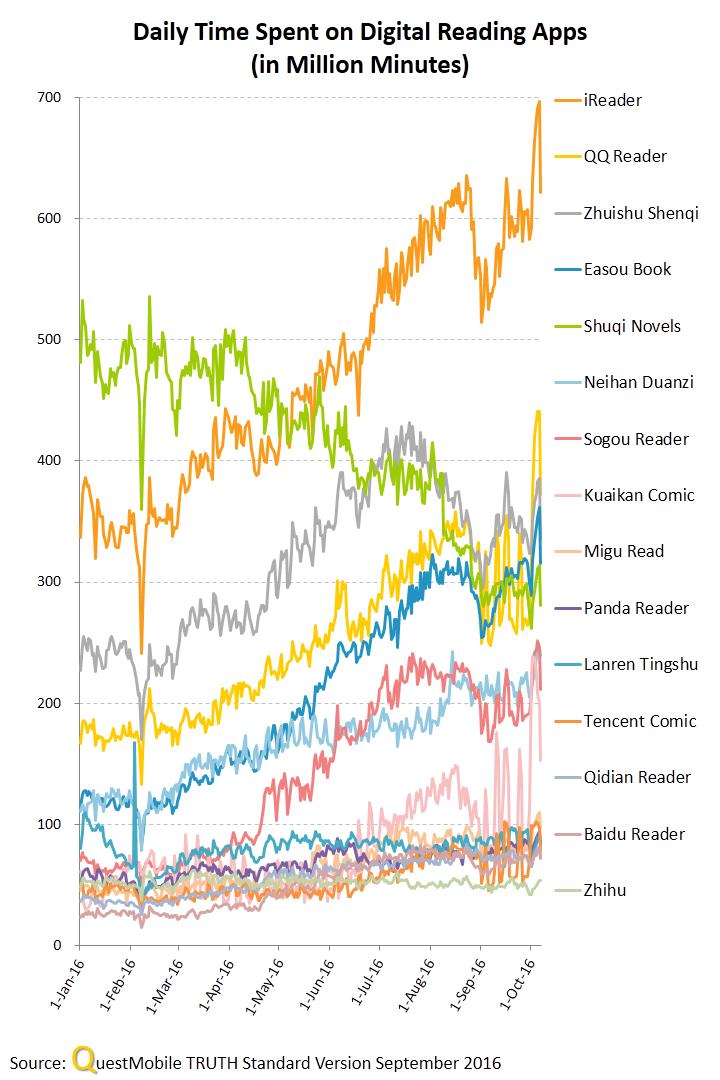
5)Digital Reading
As several digital reading apps are planning to go public, it is worth taking a closer look at this category.
6)Online Education
This used to be another hot category that did not turned out well. As a result, the chart looks like the painting of kindergarteners. The user base of education apps is still small and their DAU fluctuated too widely from Sept. 28, 2015 to Oct. 2, 2016. Where are the rising stars determined to break into campus social networking market through education apps?

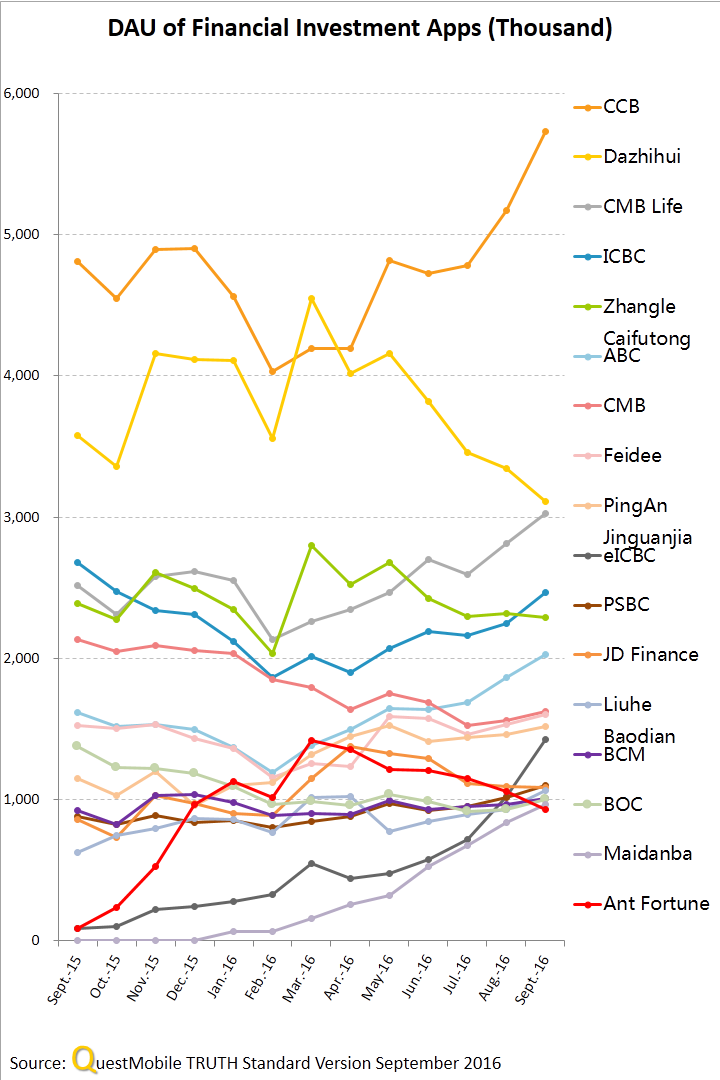
7)Financial Investment
It should be noted that Alipay and Tonghuashun are not shown in the chart due to their exceptionally large DAU. Among the remaining financial investment apps, China Construction Bank secured the top spot. However, China Merchants Banks beat its rival in total size with a series of financial apps. In addition, Dazhihui saw fluctuations and a sharp decline in DAU during the period.
8)House Rentals
On the whole, the user base of house rental apps remains small with WAU of top apps fluctuating around millions. Apart from Soufun, Anjuke and Lianjia, the other players lacked strong growth momentum. This may ascribe to the fact that property purchase is a much lower-risk investment option than starting a business or capital investment in China and that those eager to buy and invest in properties are busy doing so instead of engaging in the apps.

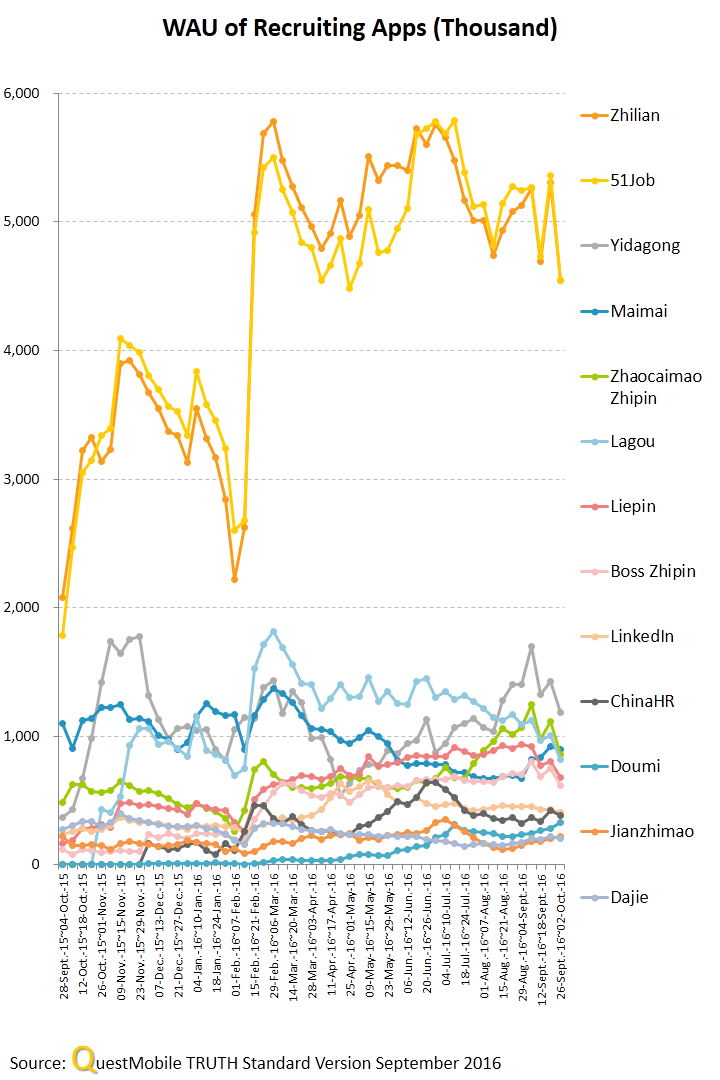
9)Online Recruitment
This category has two clear winners, Zhilian and 51Job, who are at each other’s throats vying for the top spot.
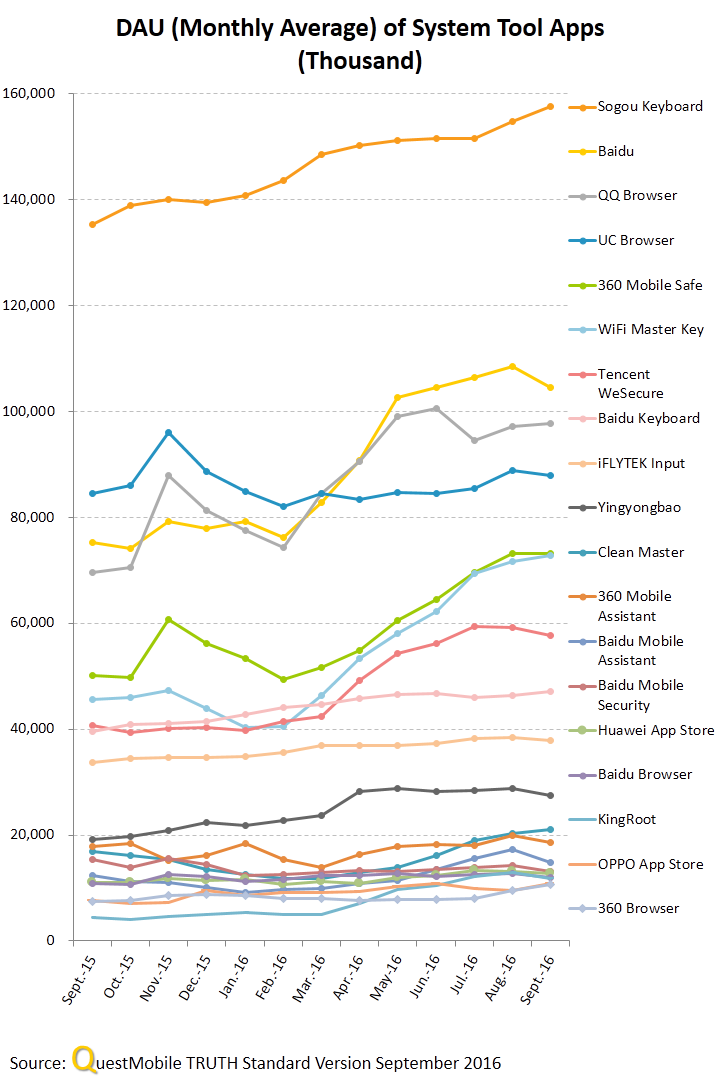
10)System Tools
Sogou topped system tool app chart with DAU approaching 160 million in Sept. 2016, followed by Baidu at 105 million, QQ Browser and UC Browser around 90 million respectively.
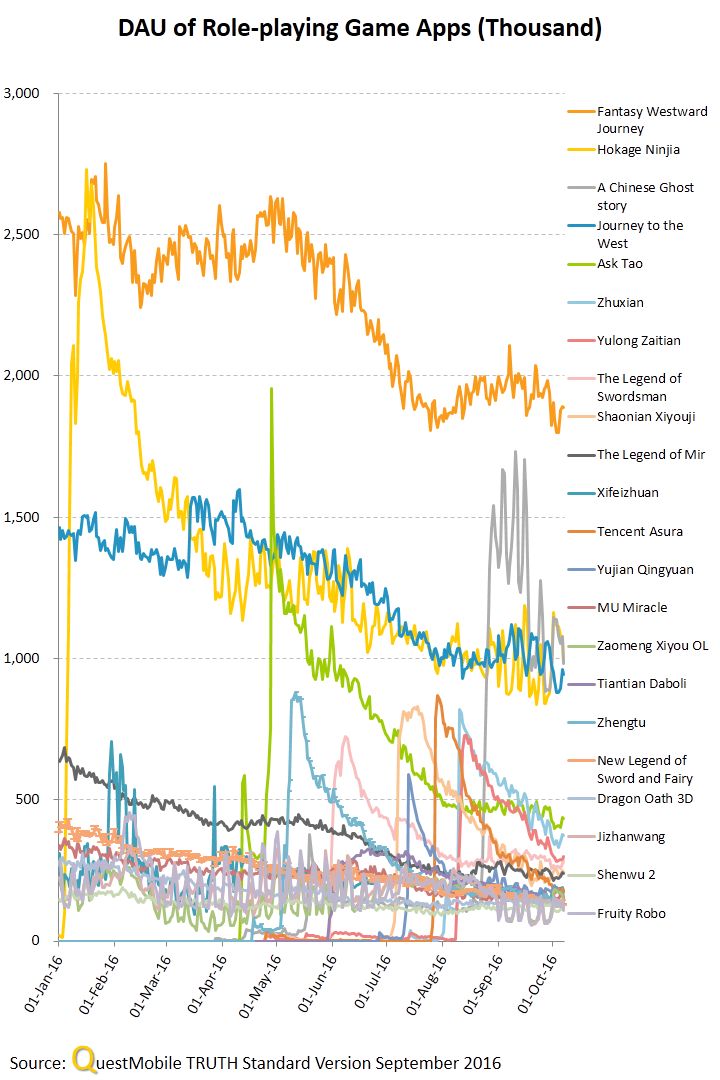
11)Role-playing Games
Among gaming apps, Fantasy Westward Journey is the most successful. Its DAU declined at a much slower rate than its peers with the potential to rebound.
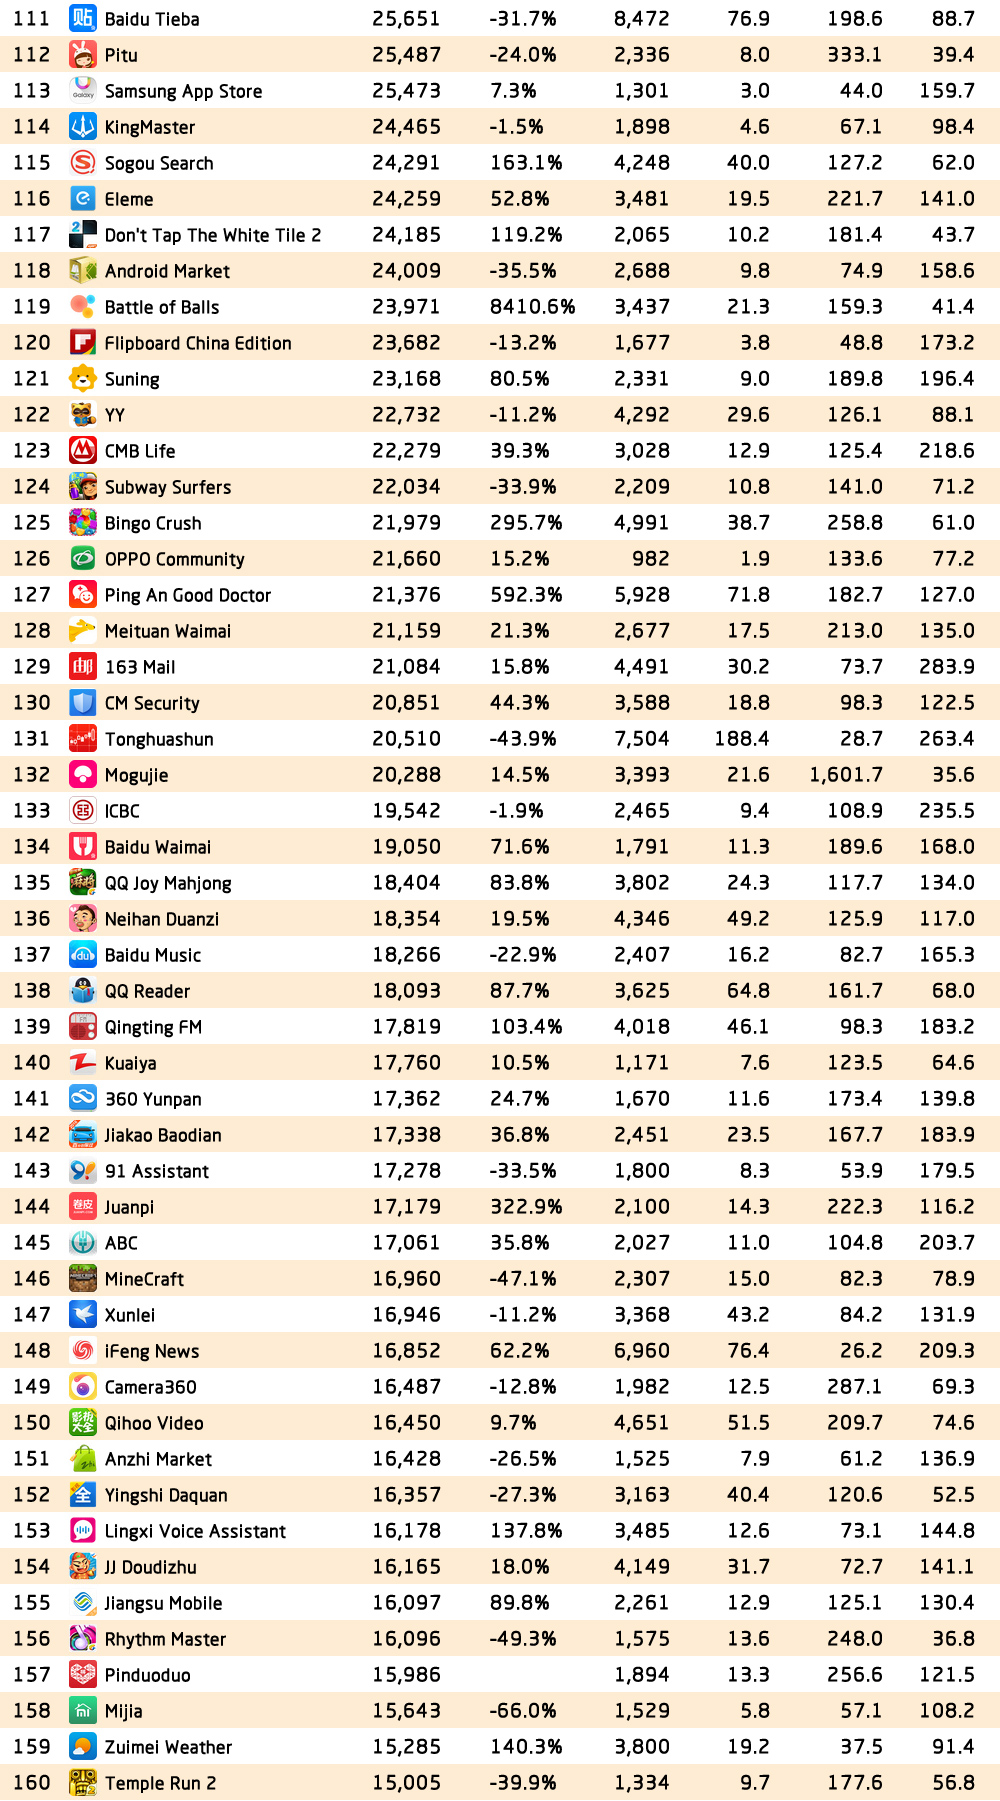
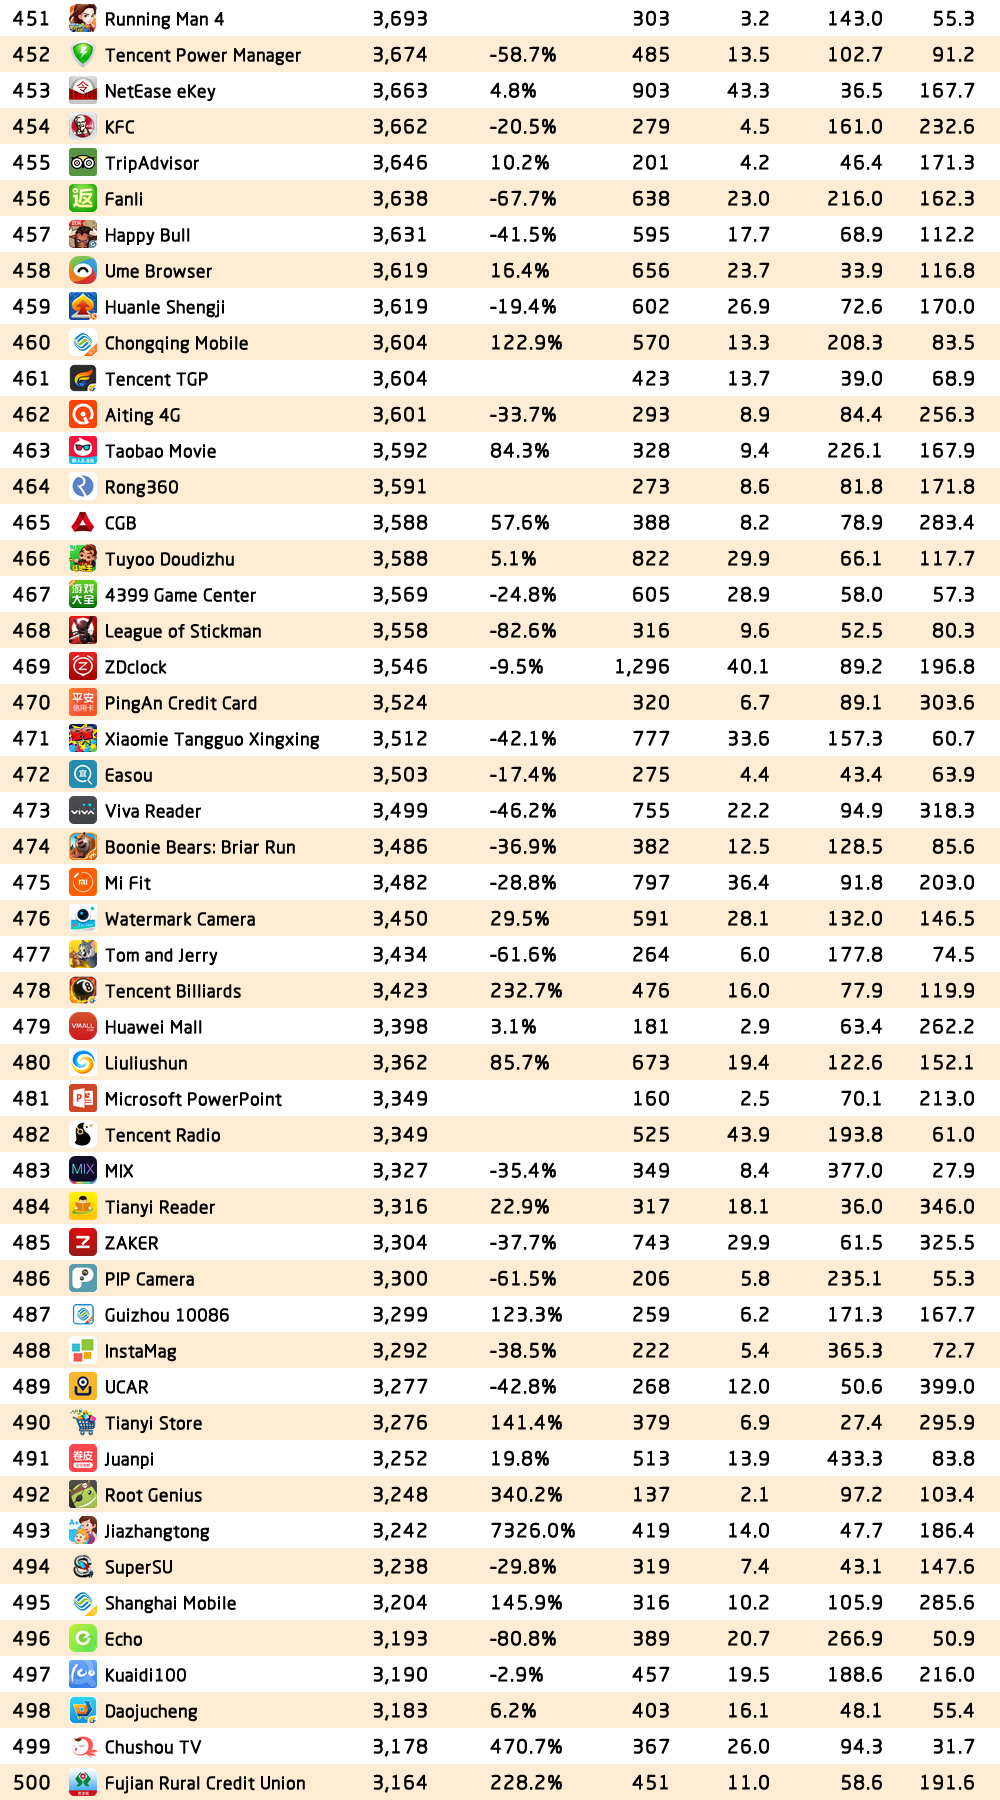
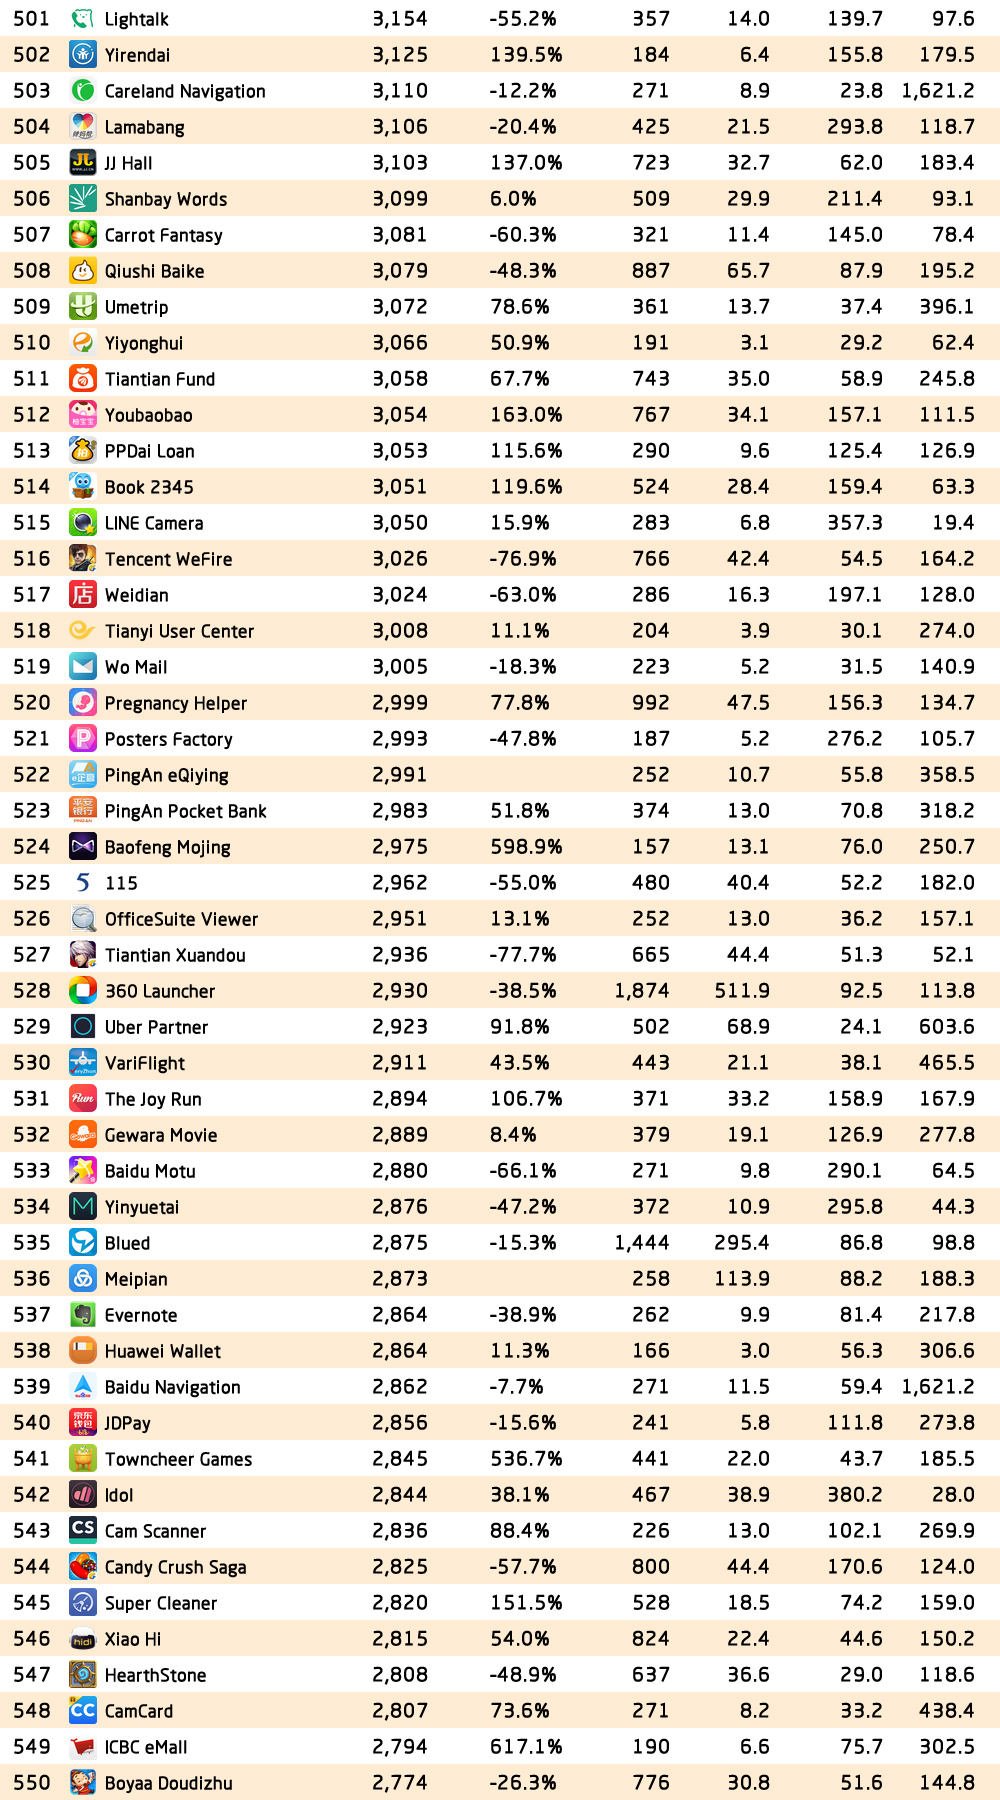
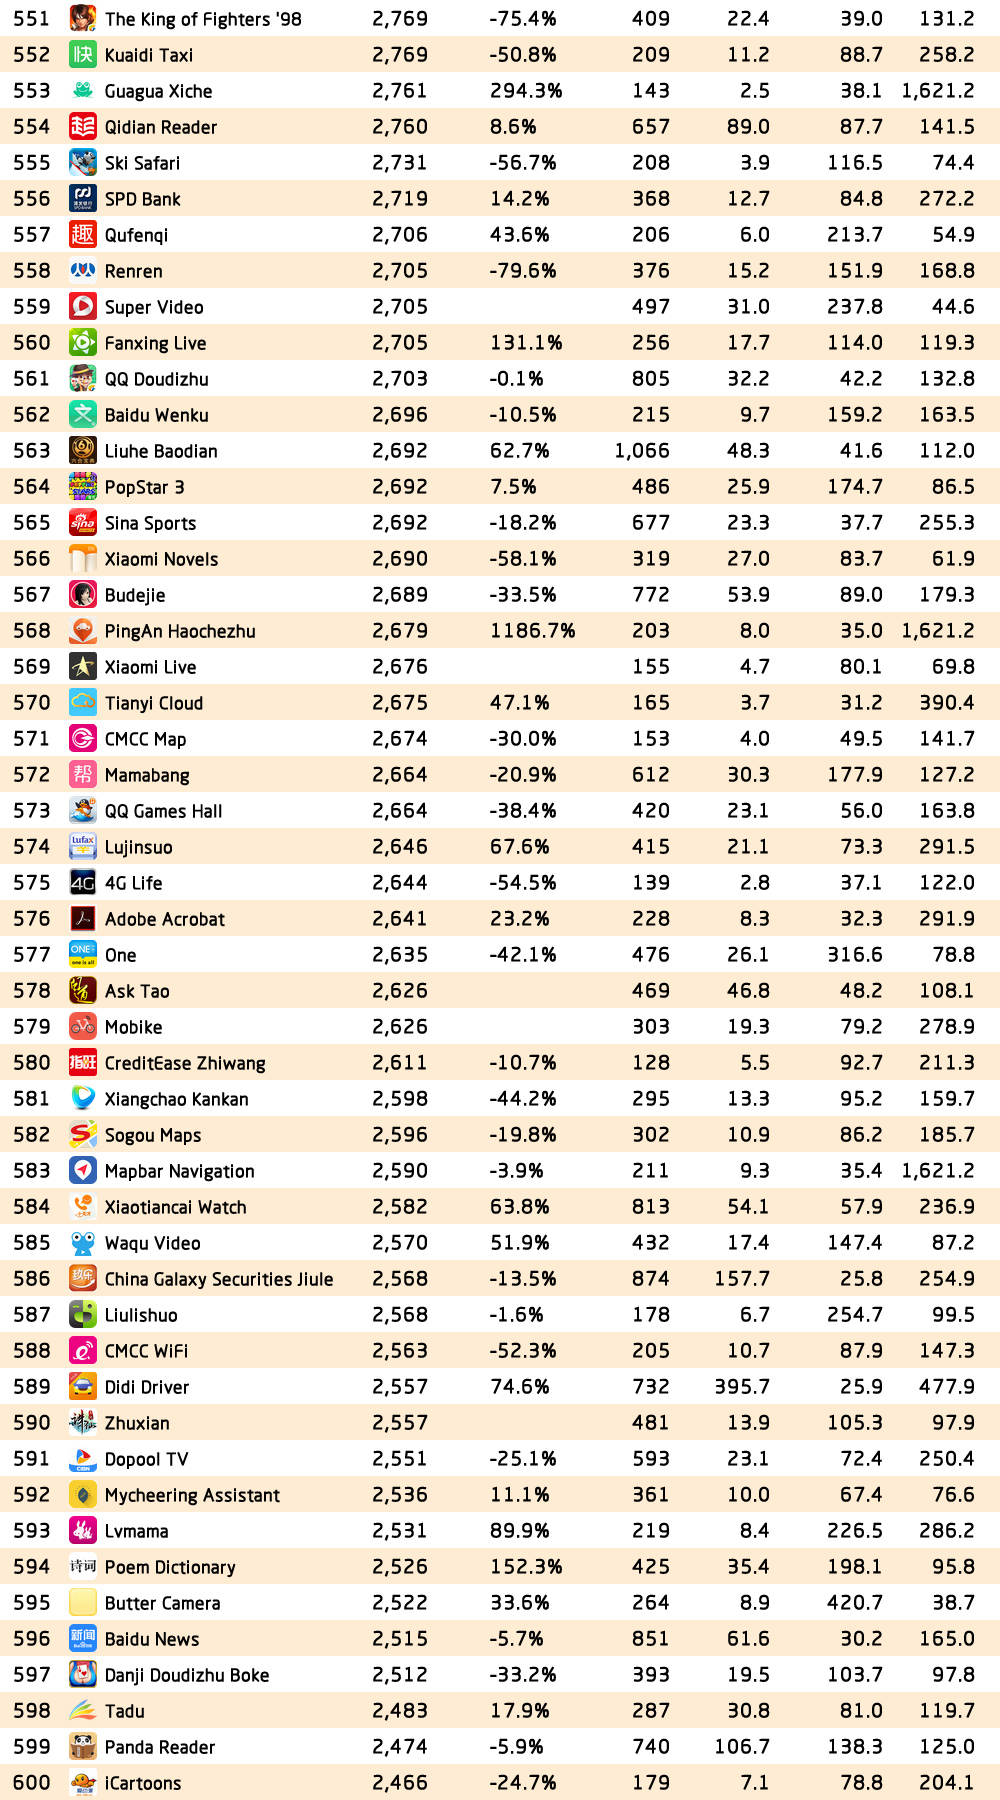
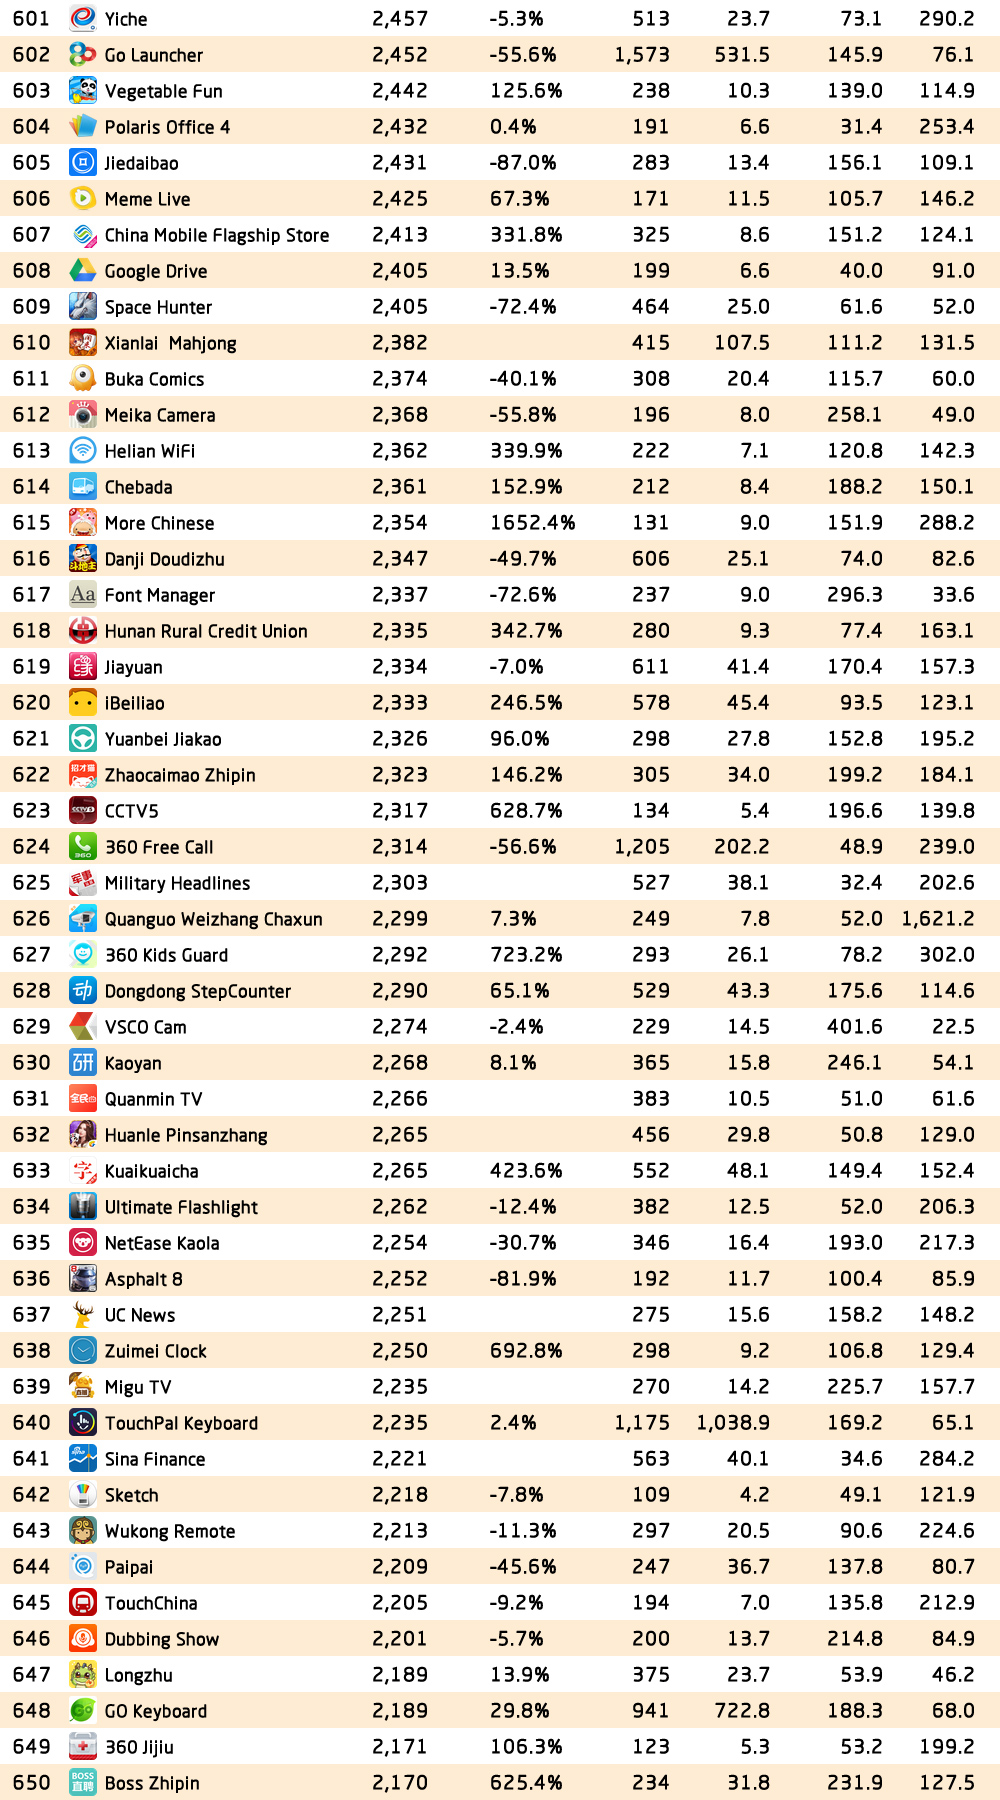
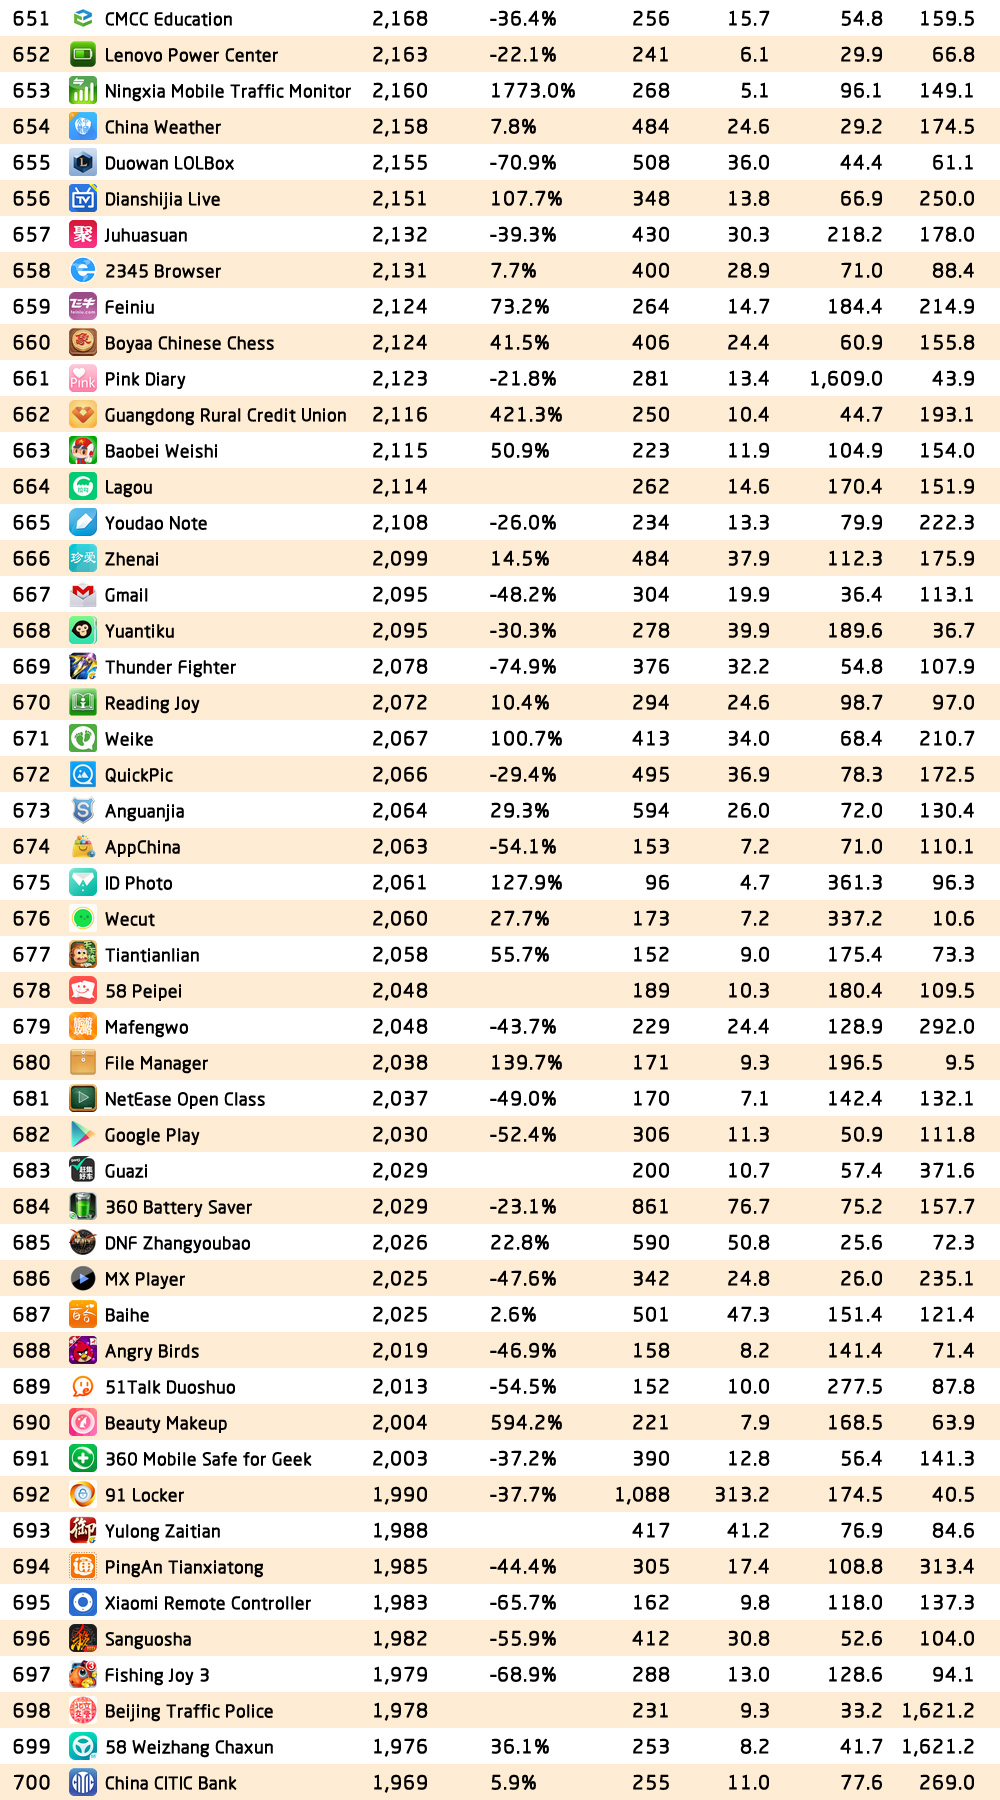
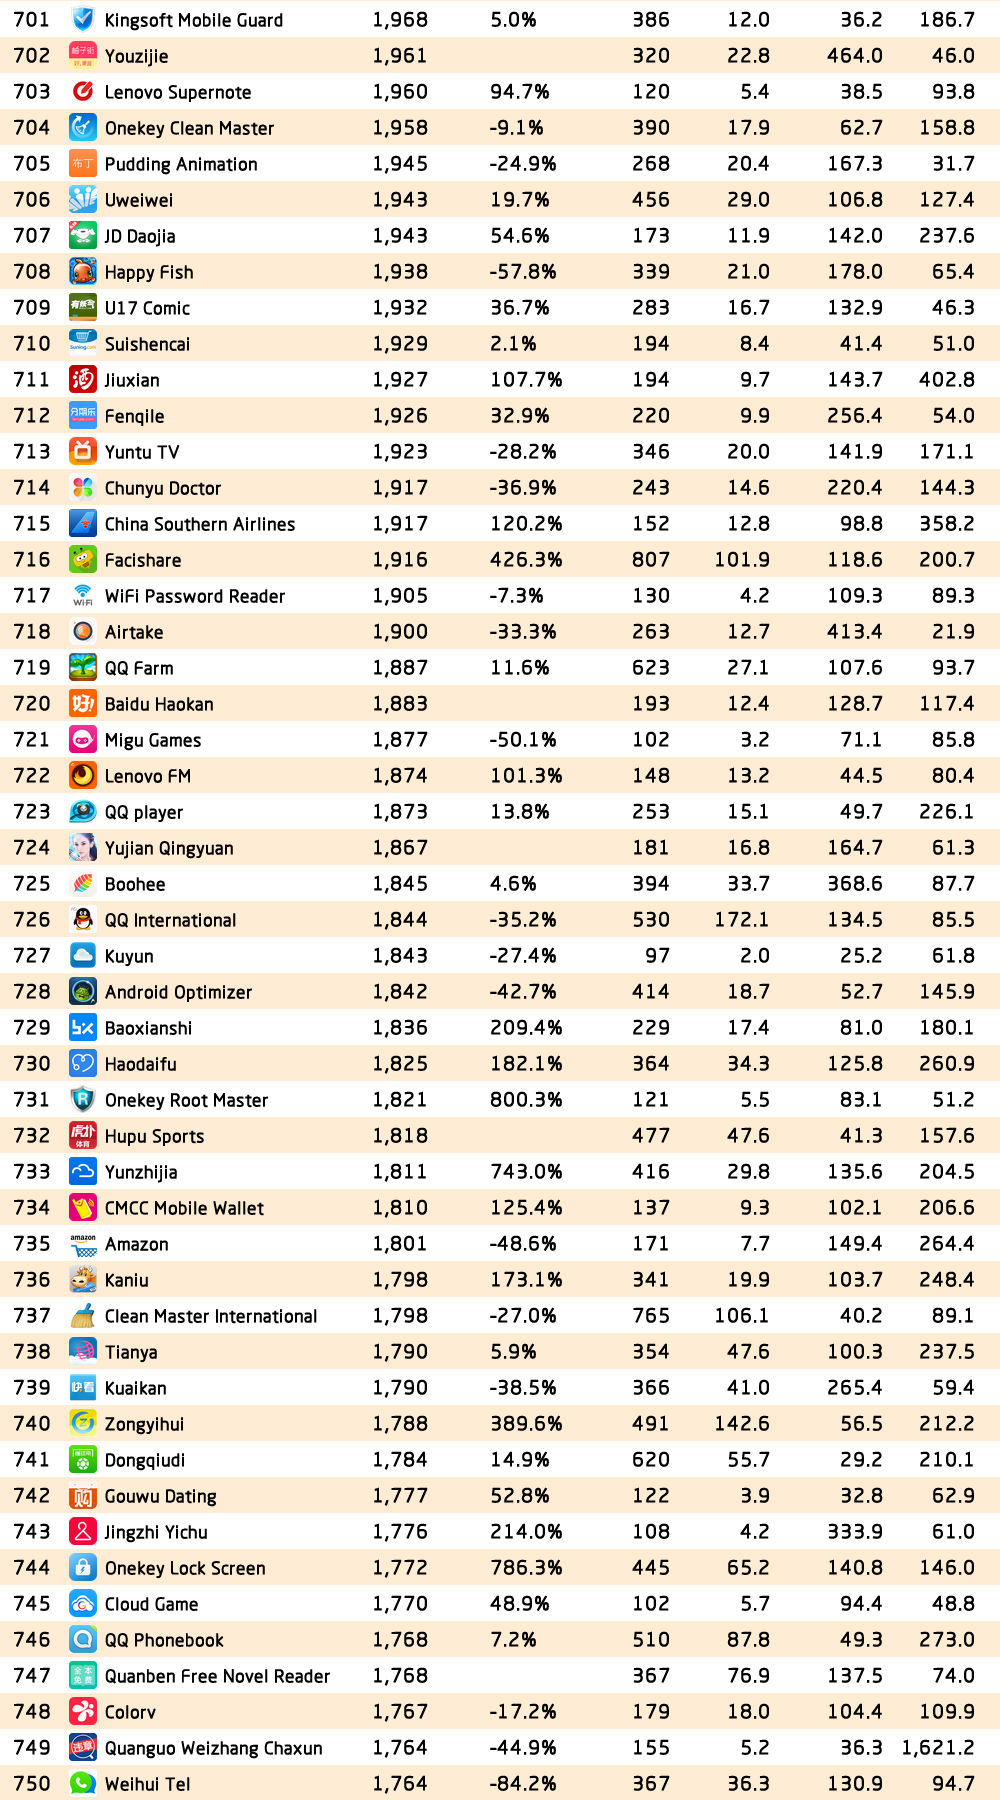
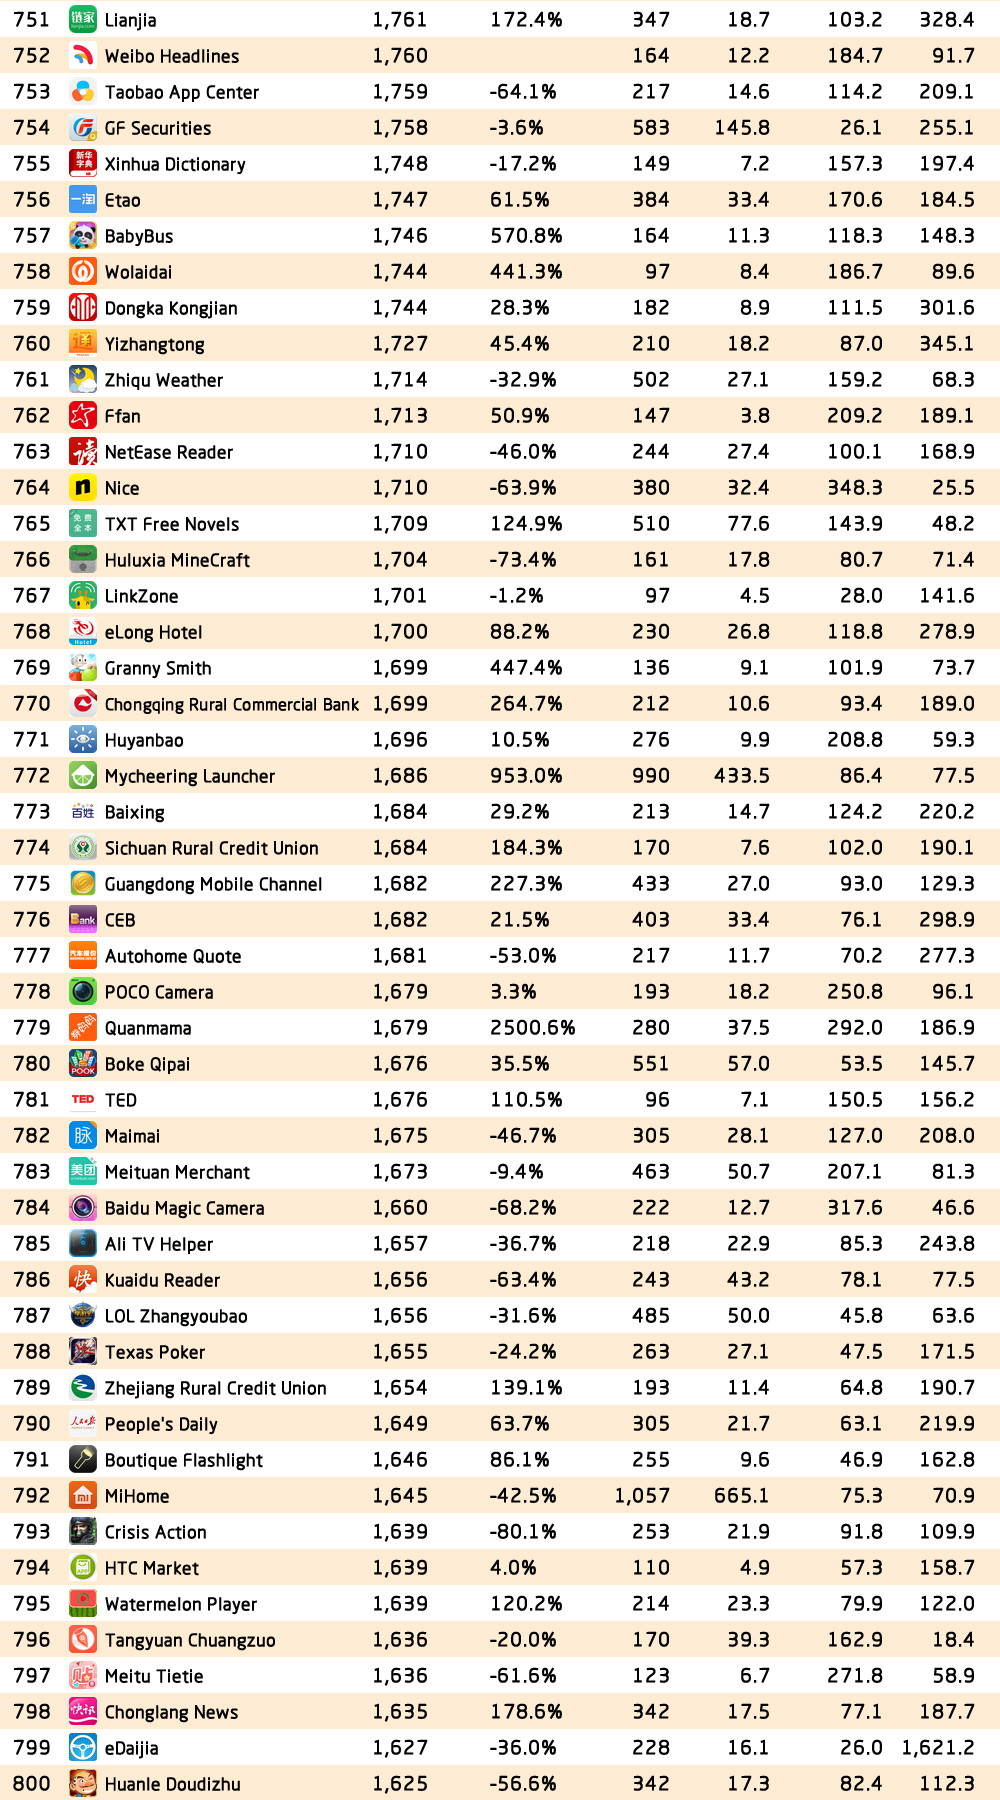
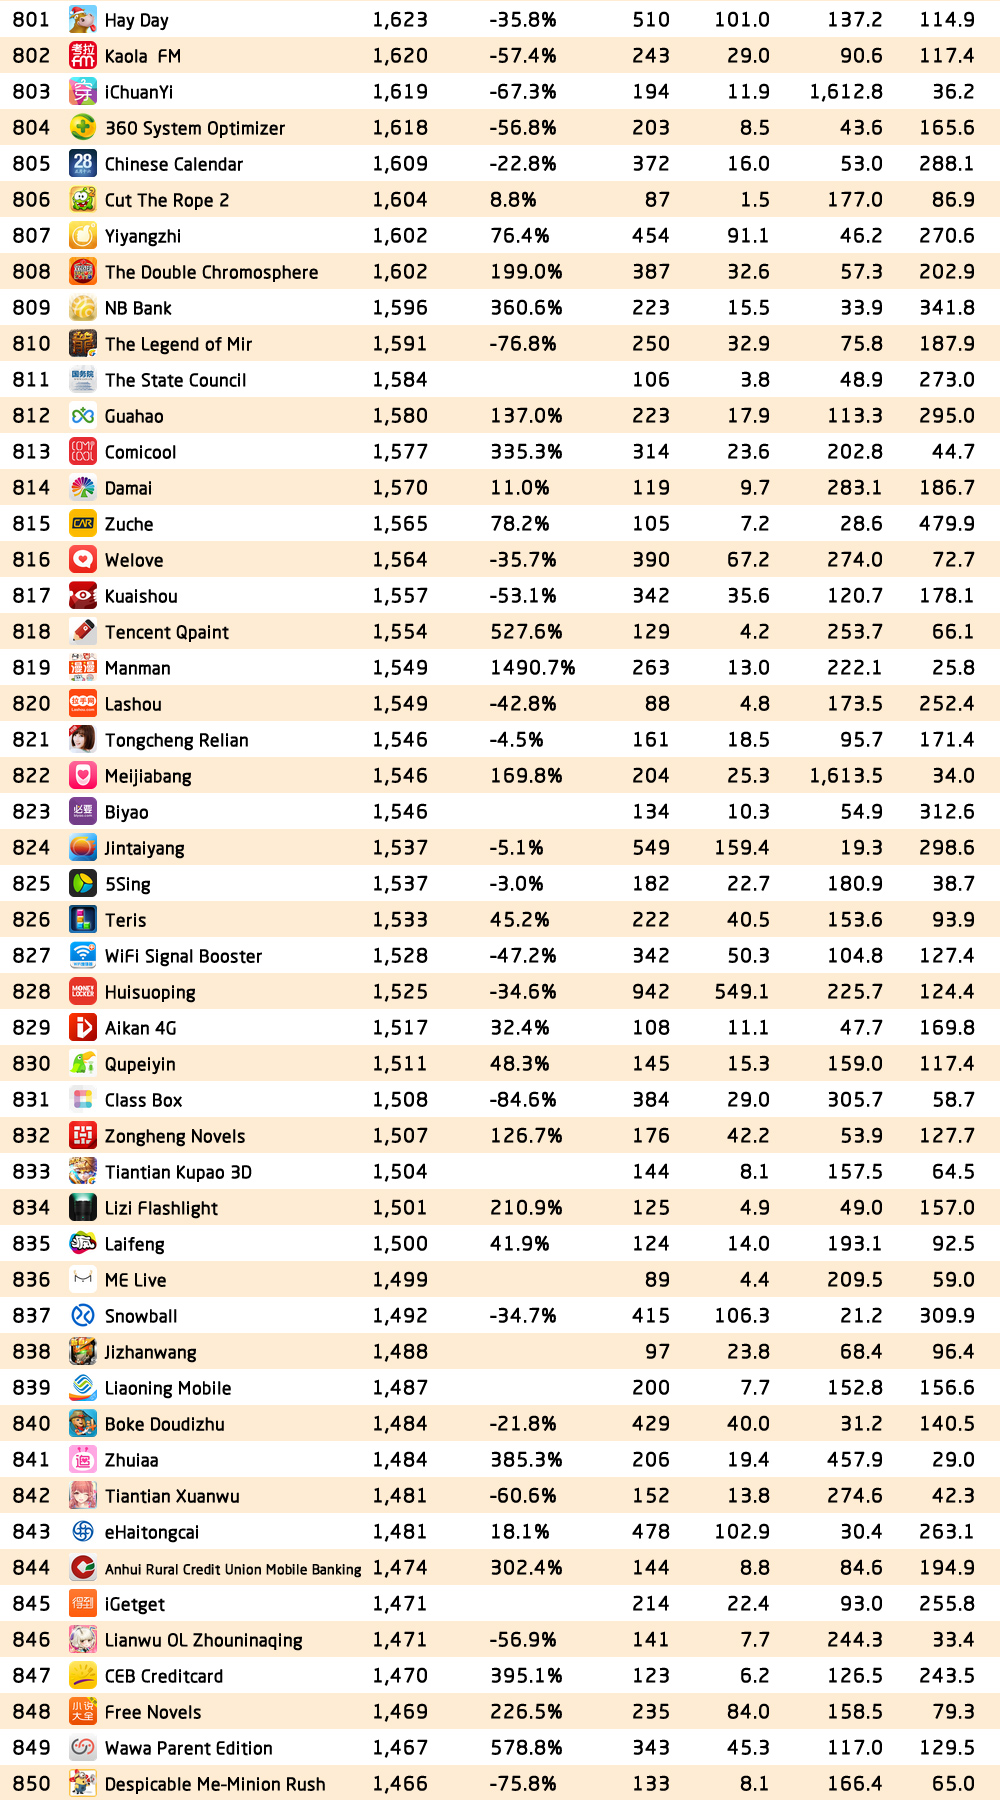
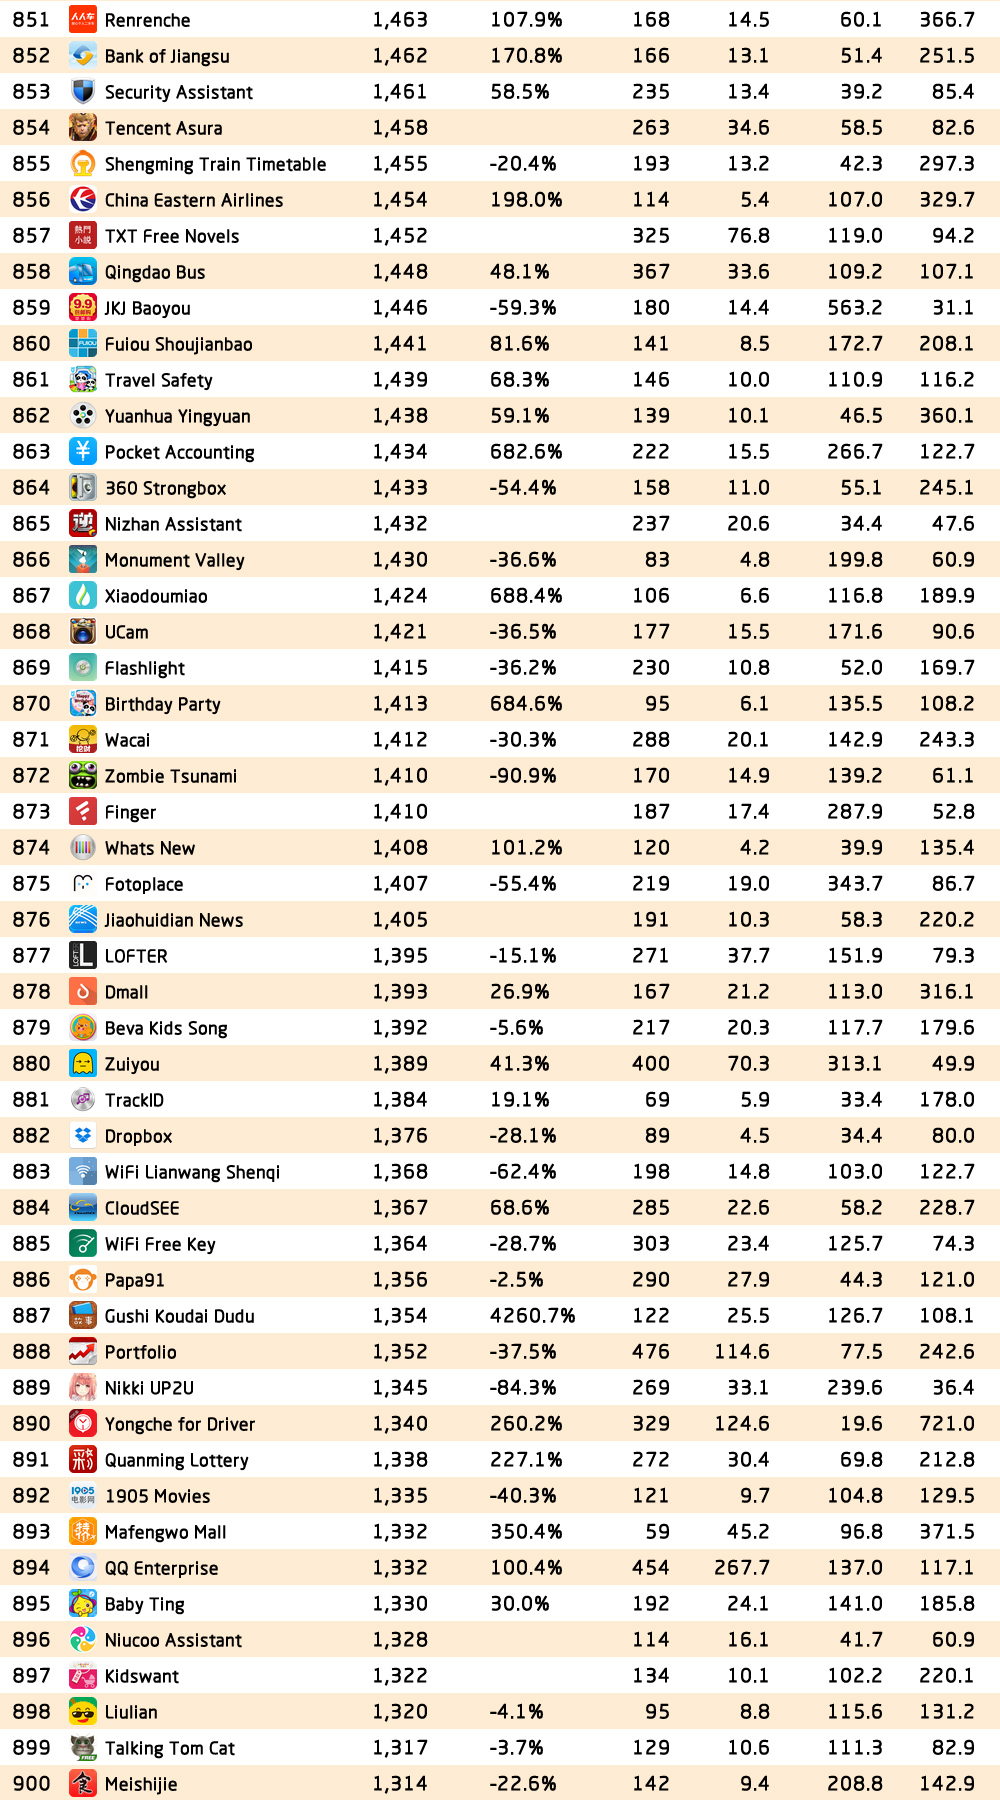
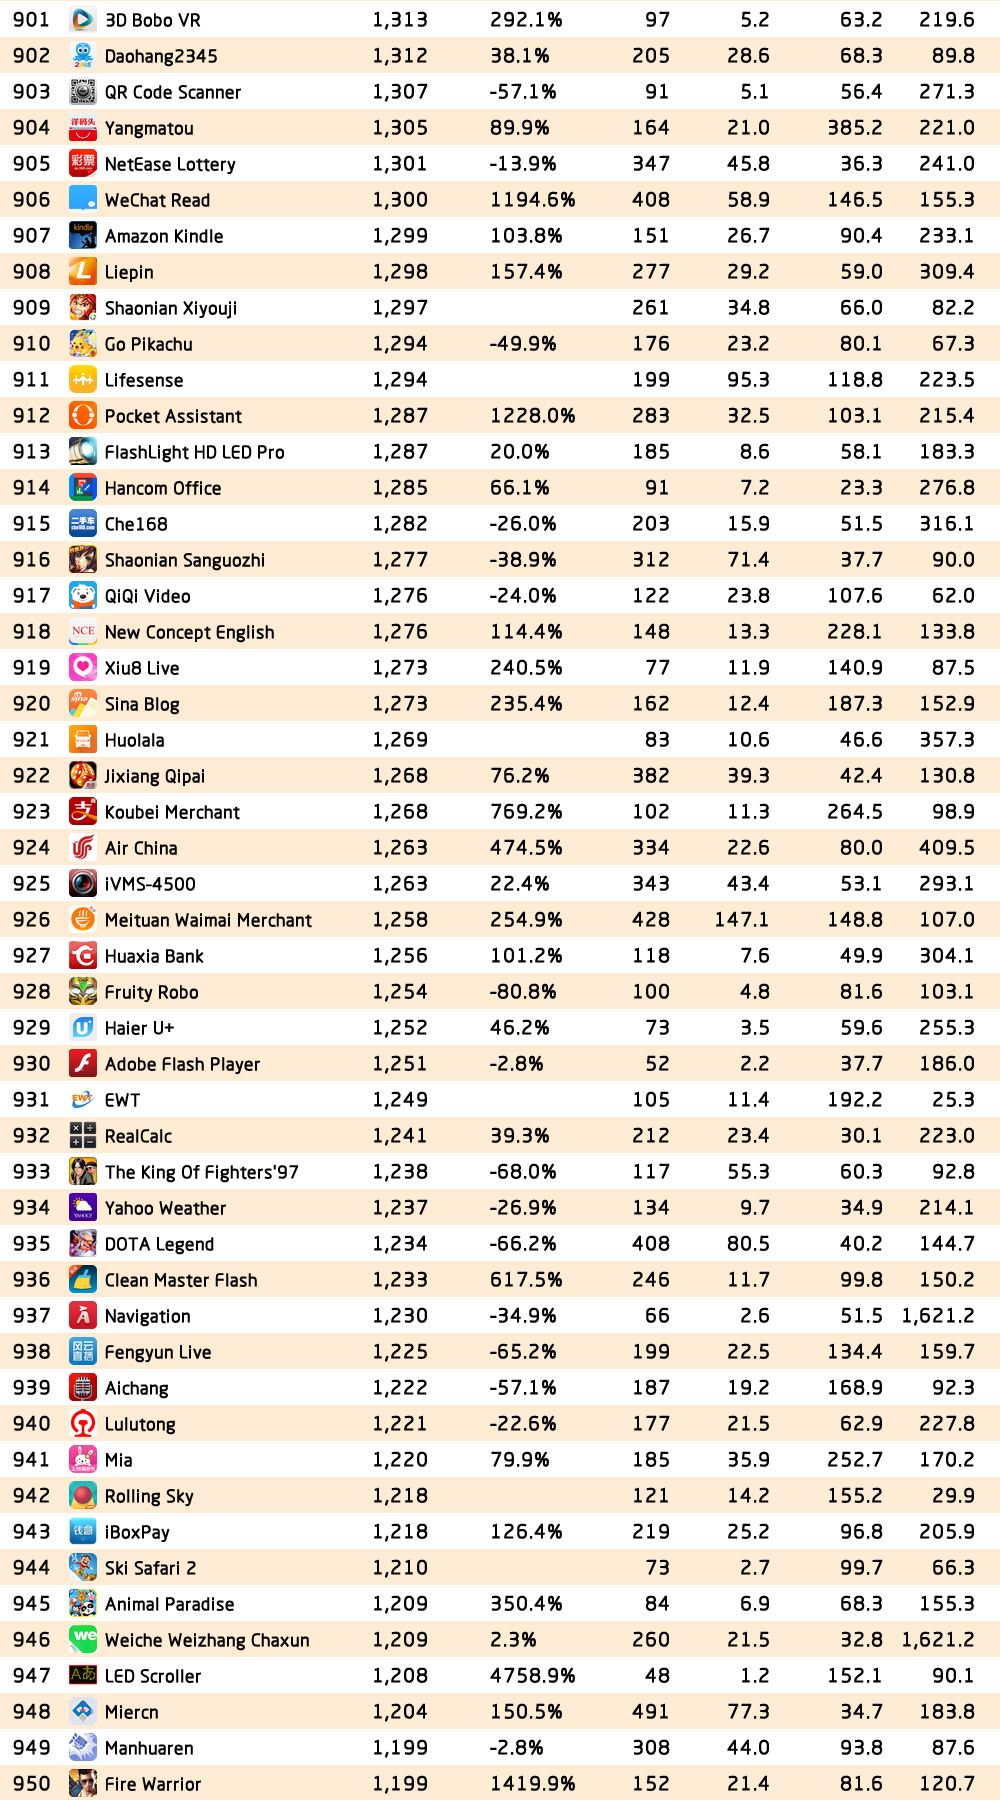
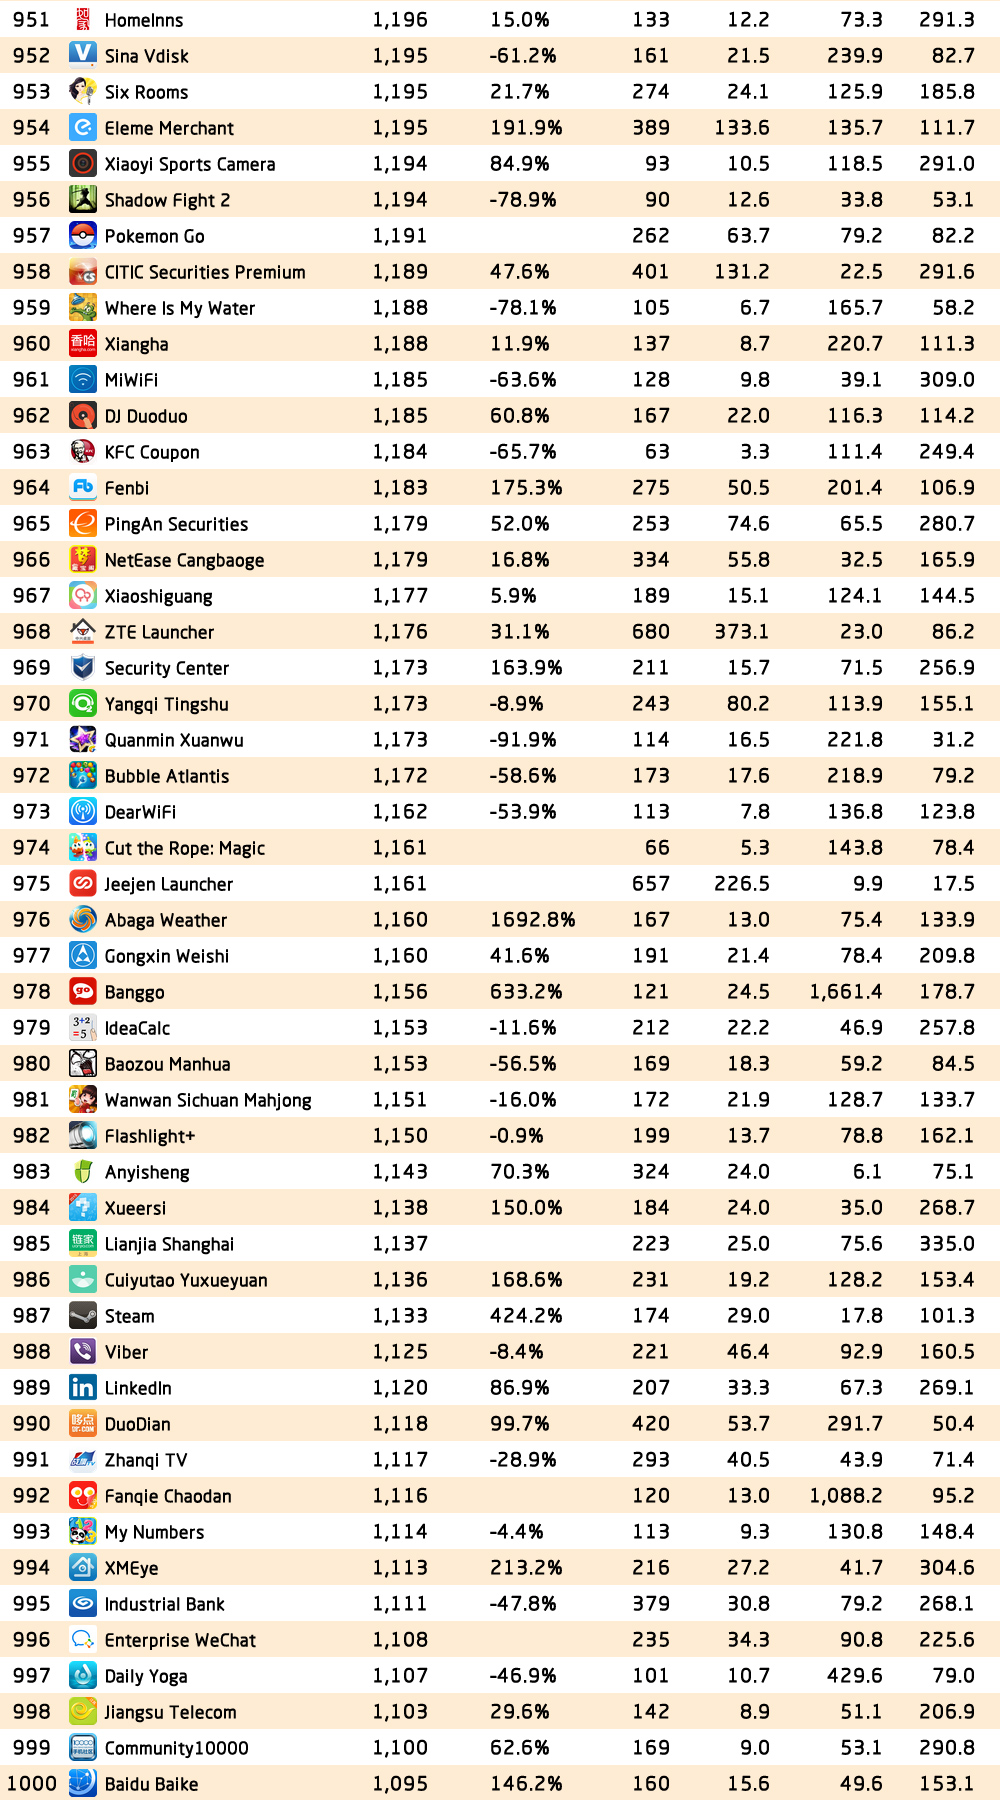
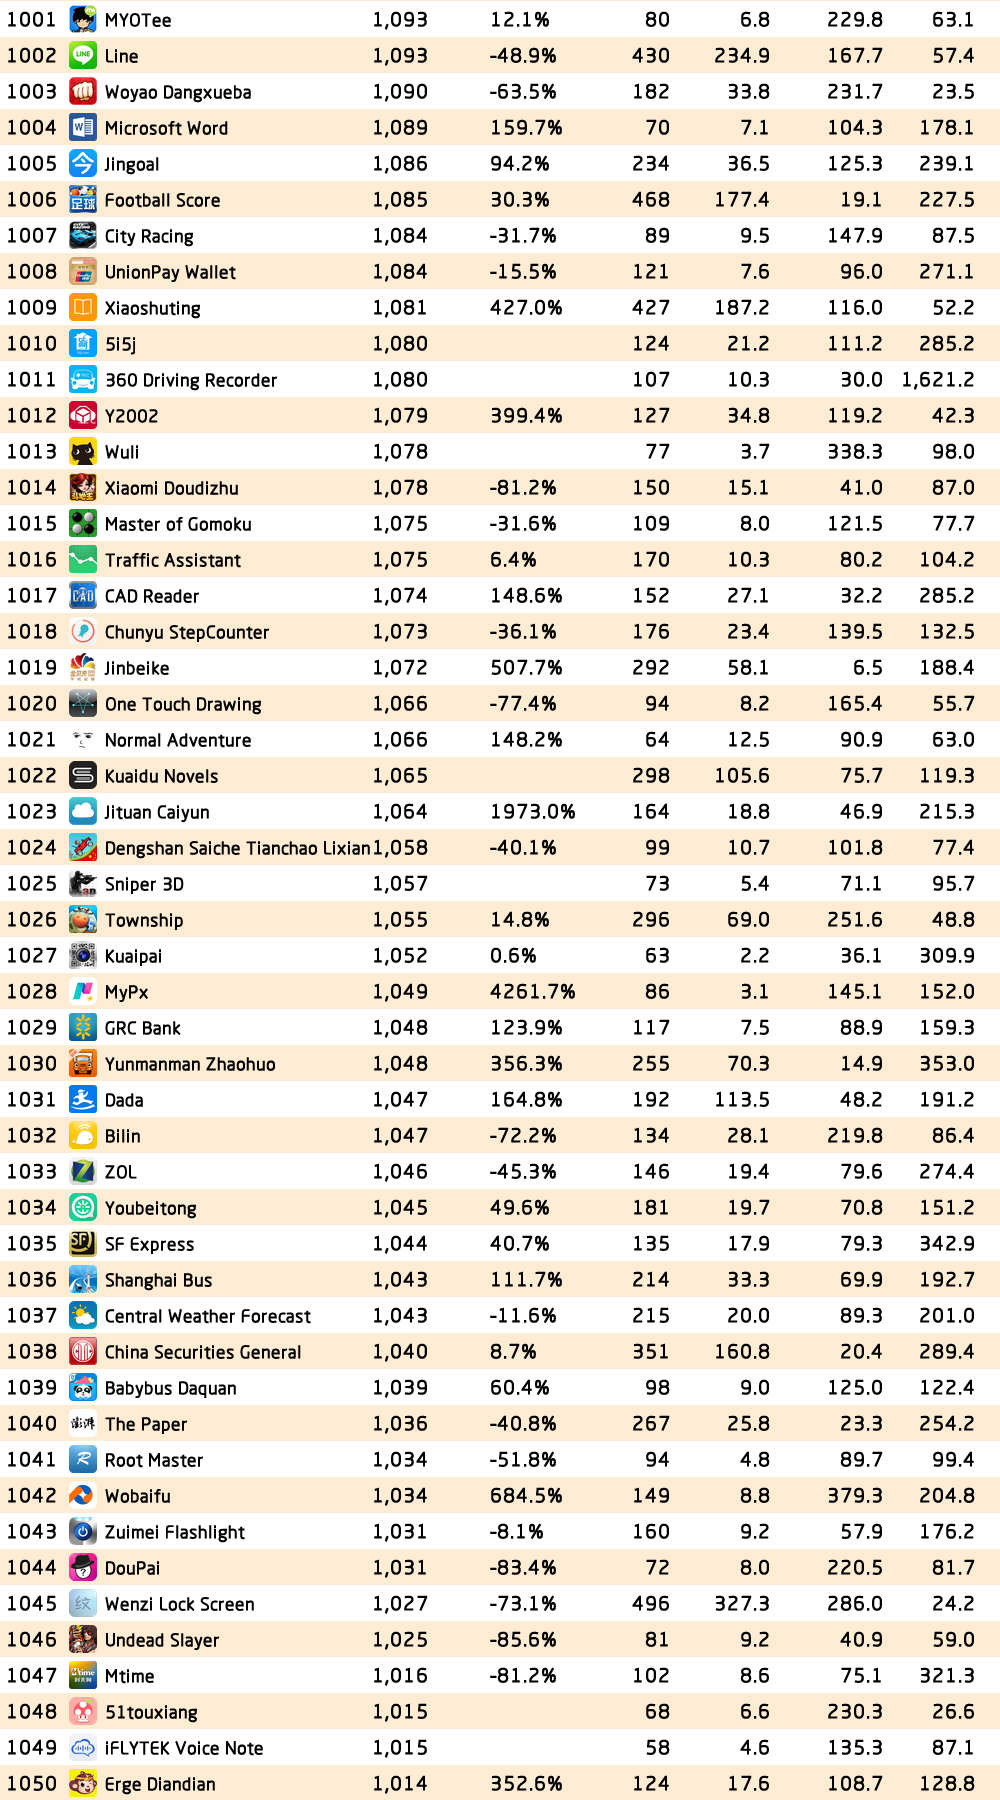
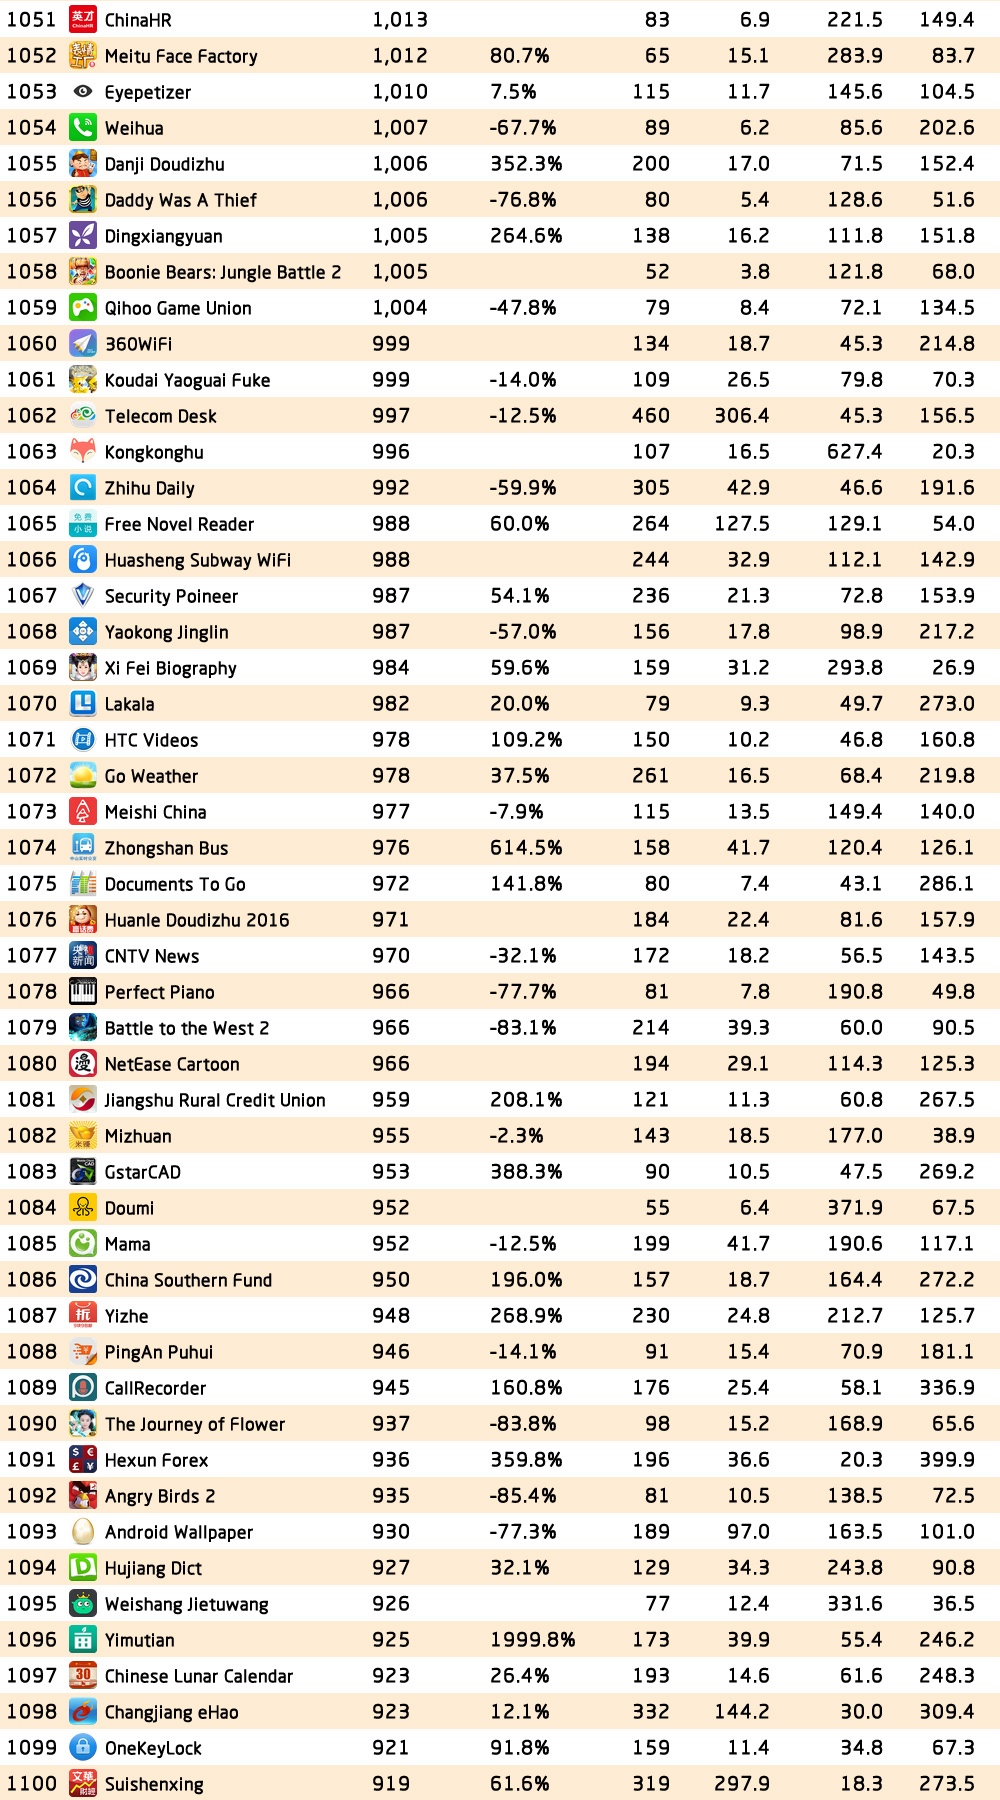
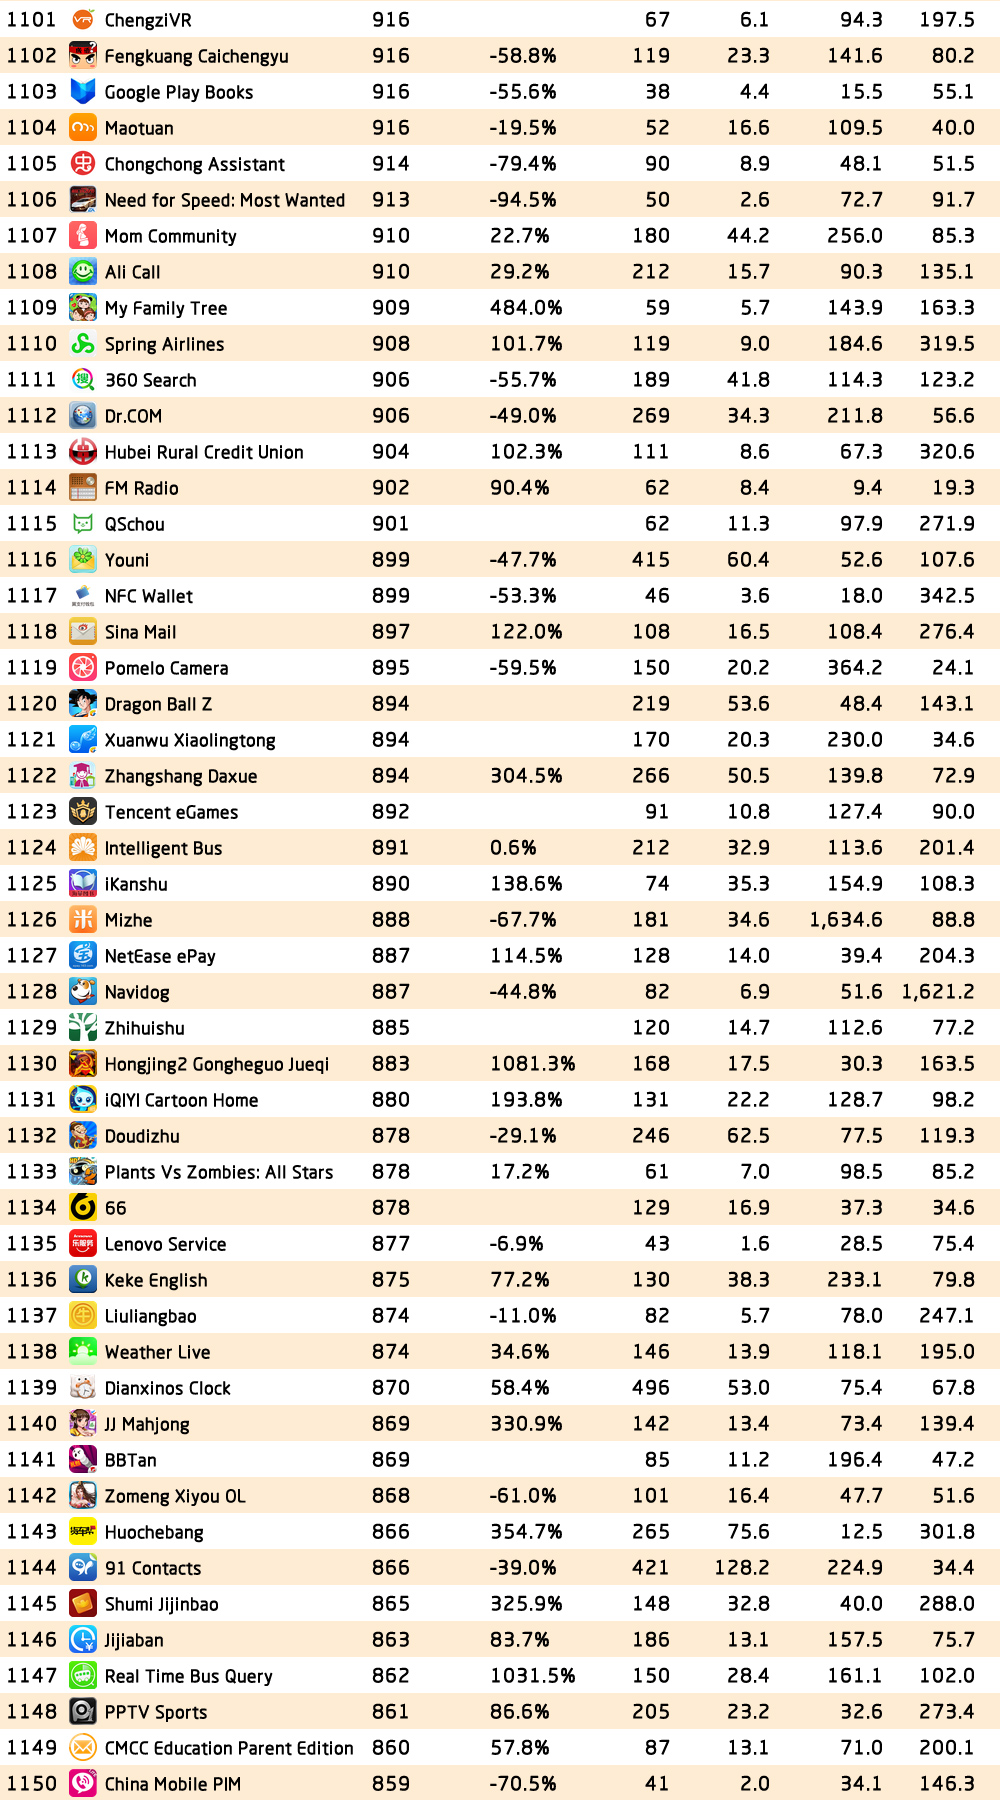
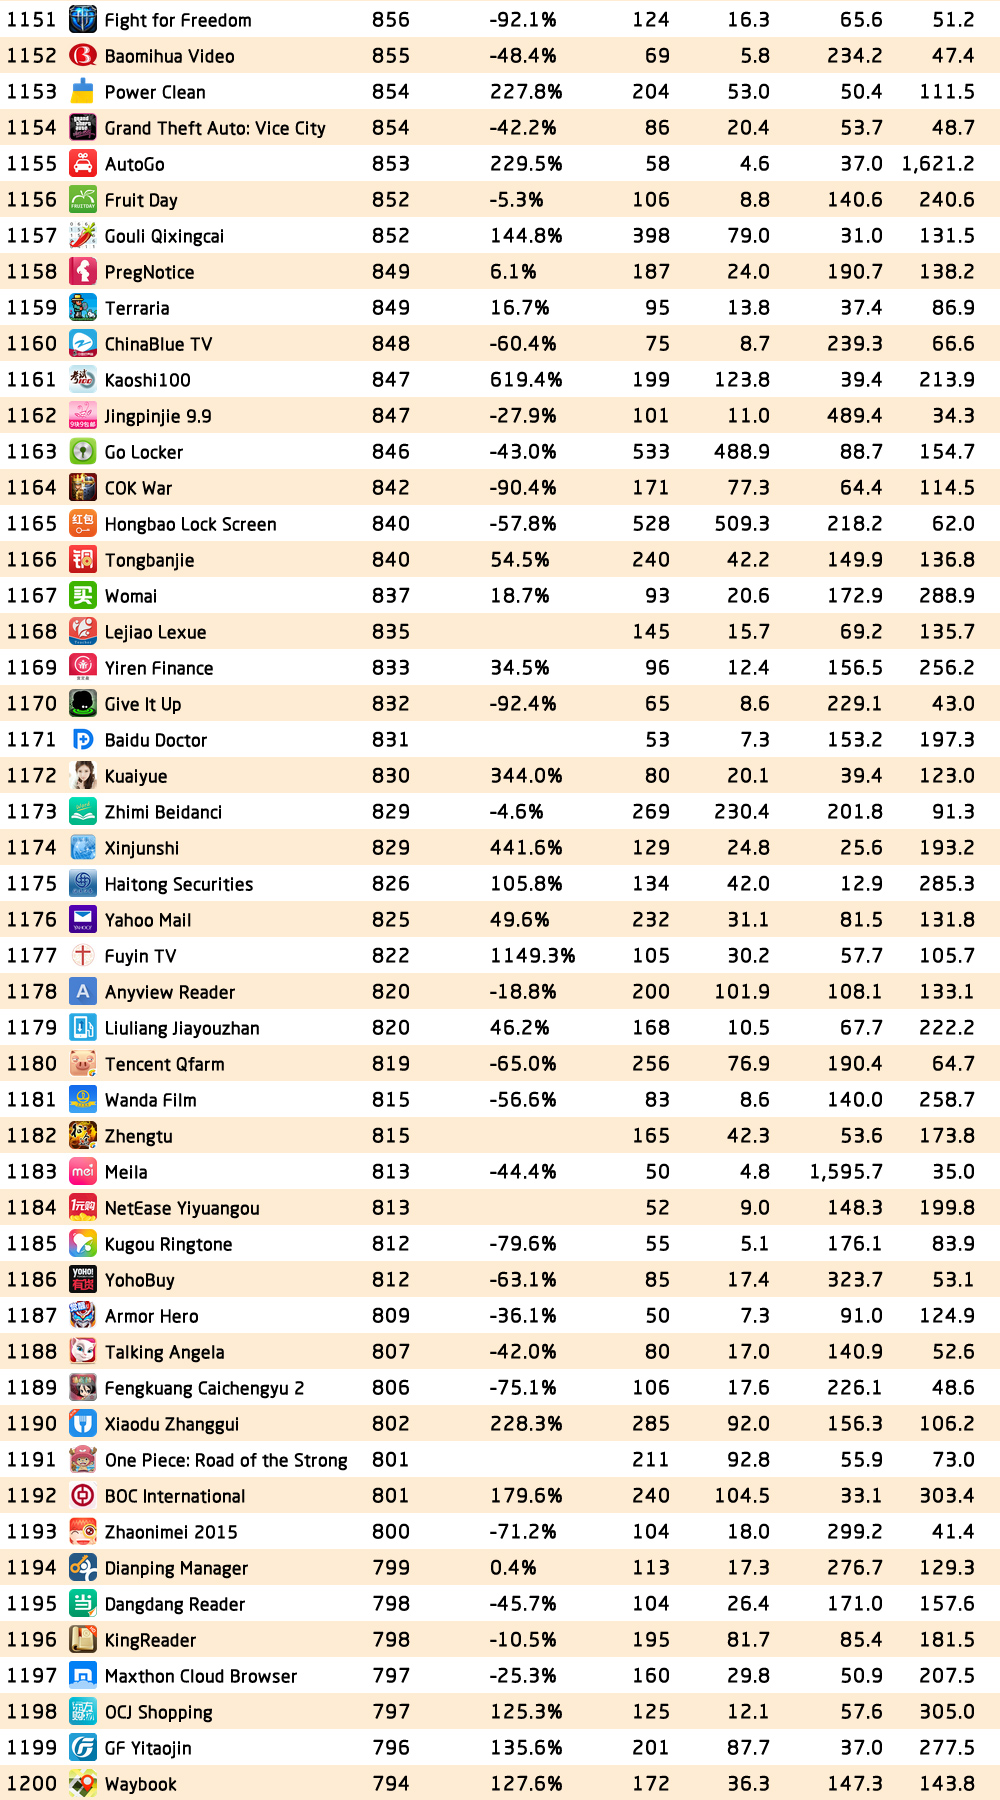
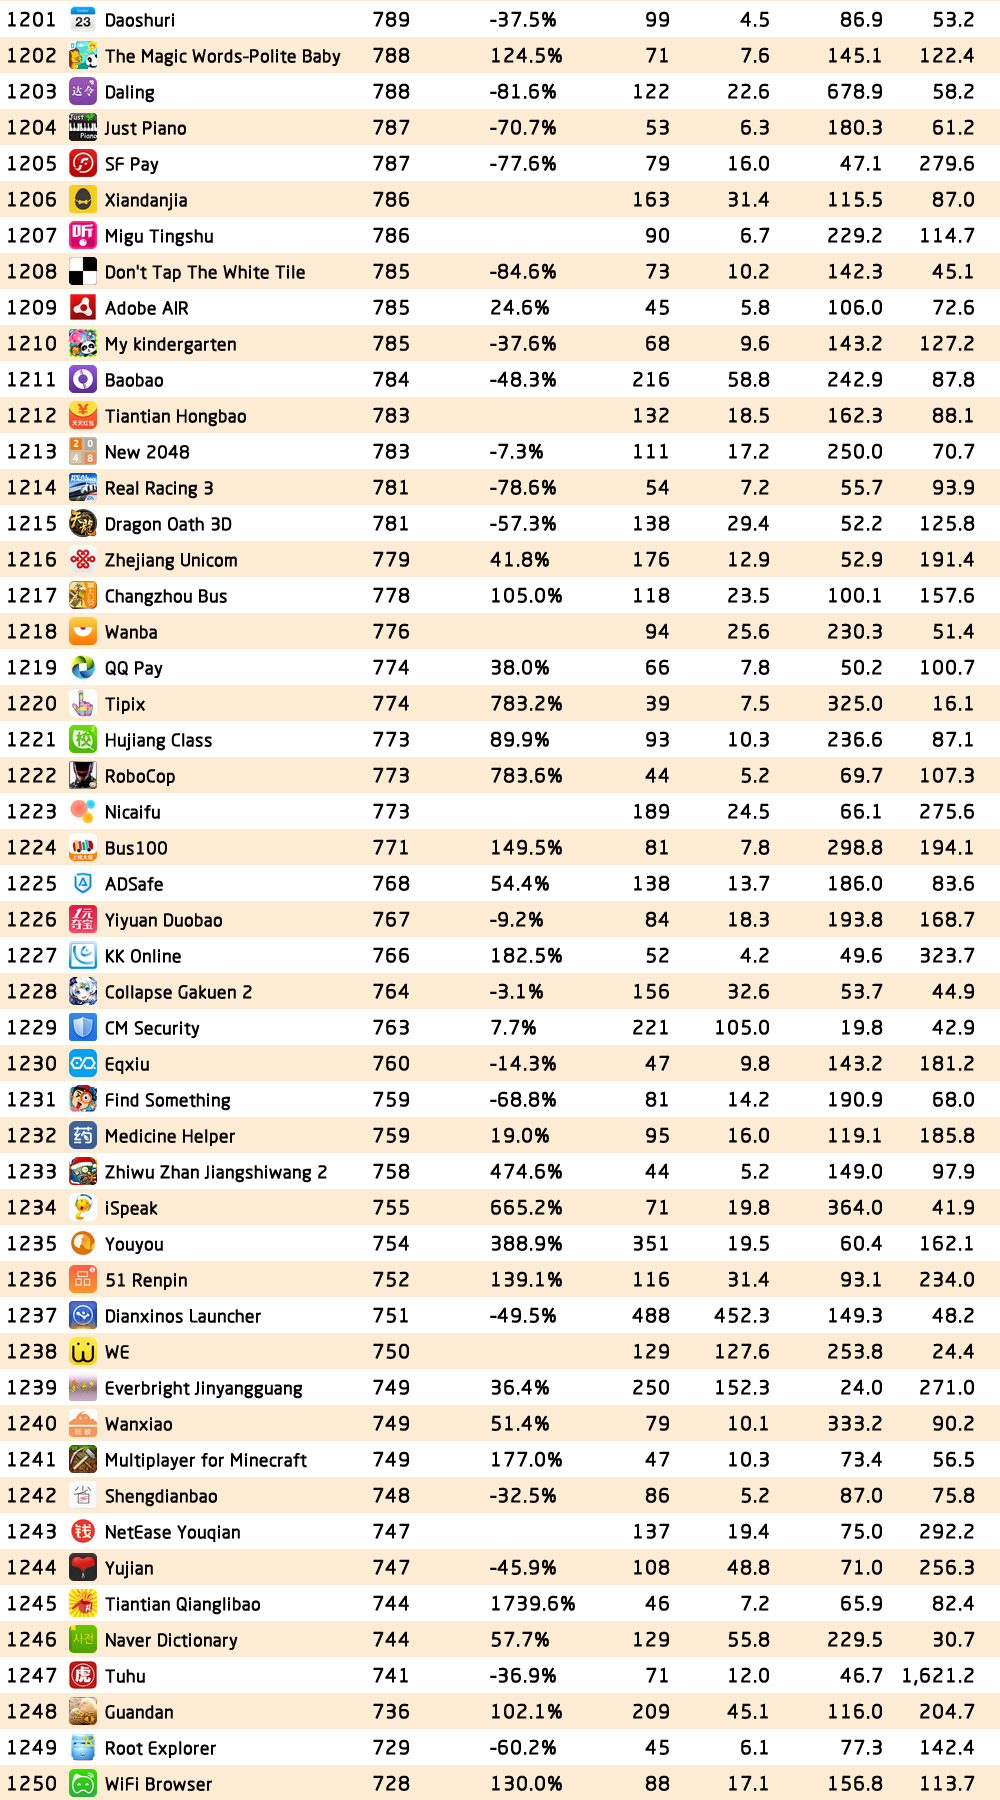
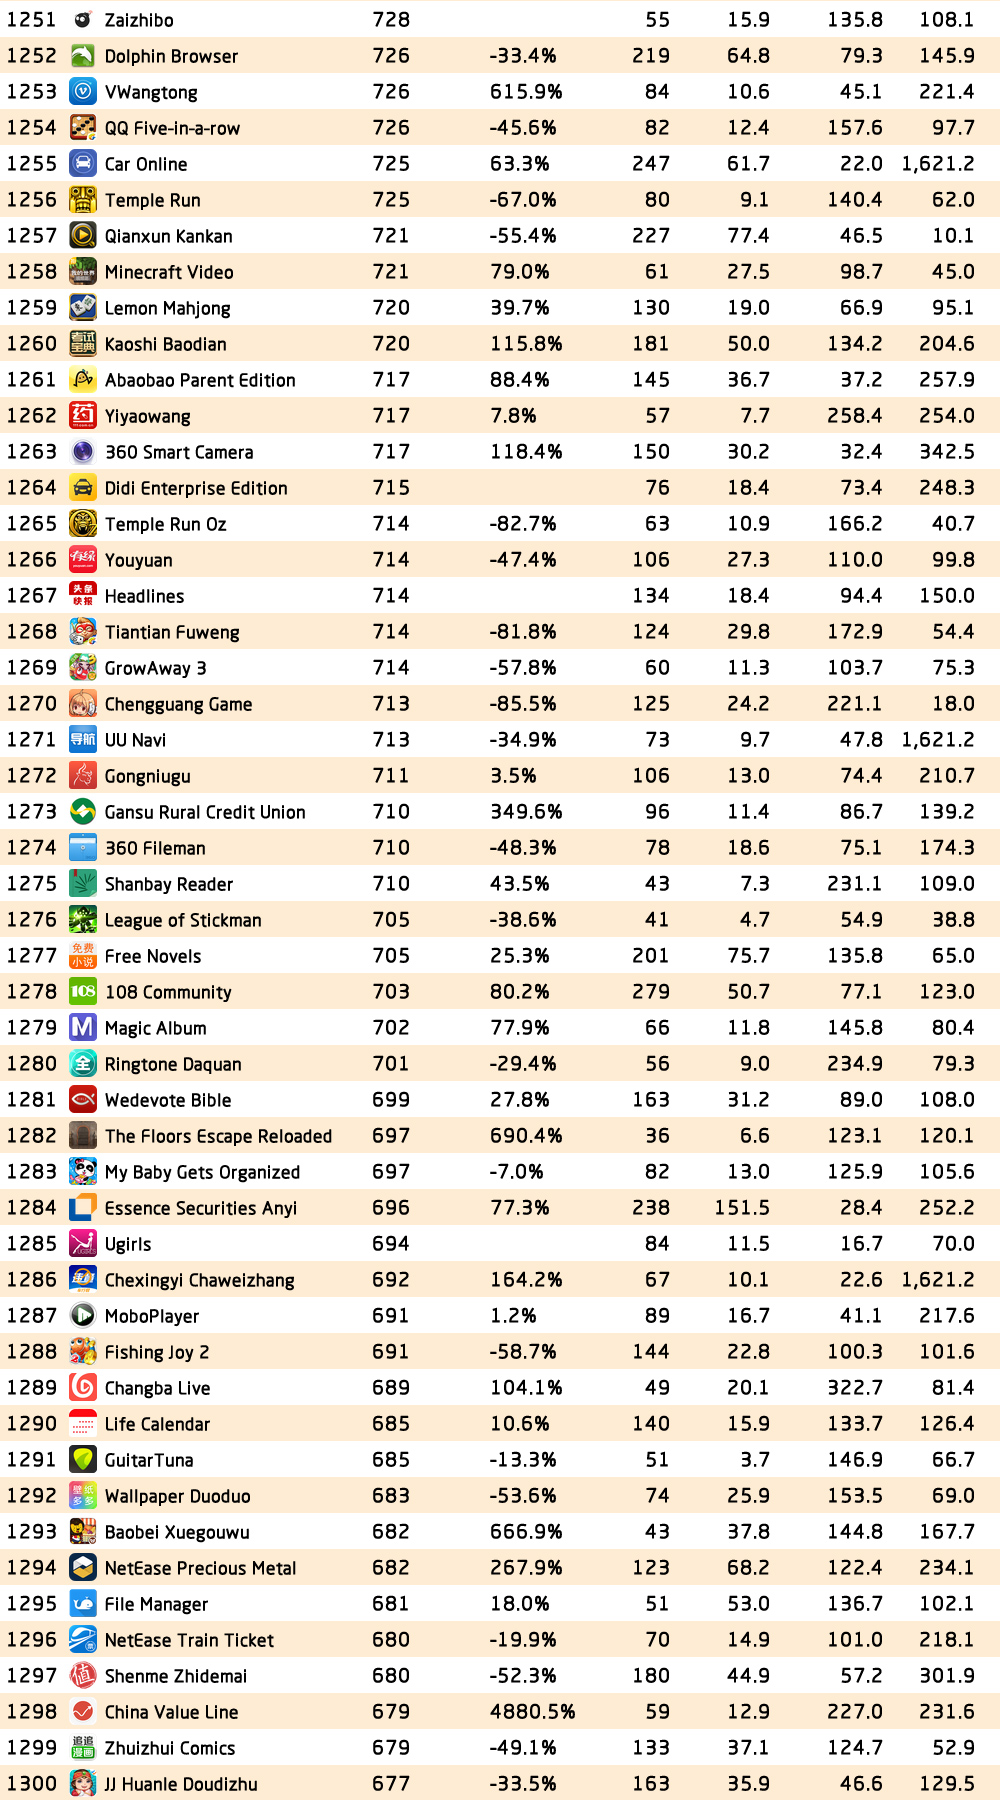
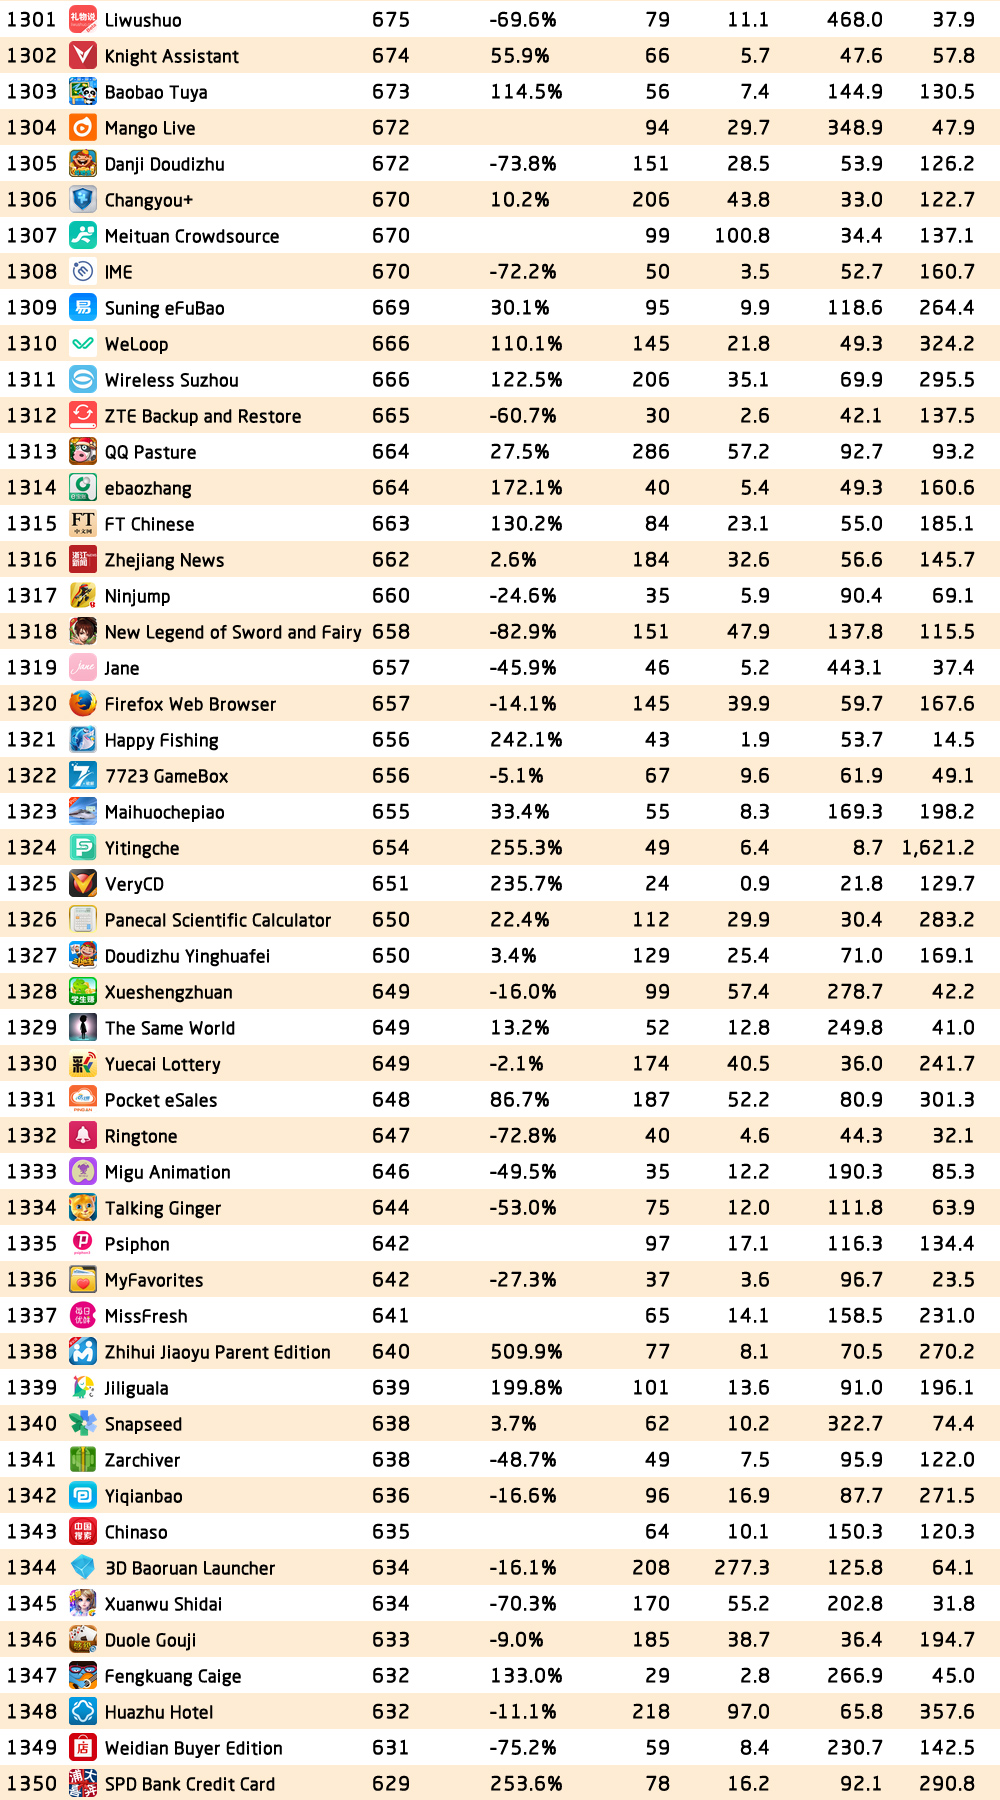
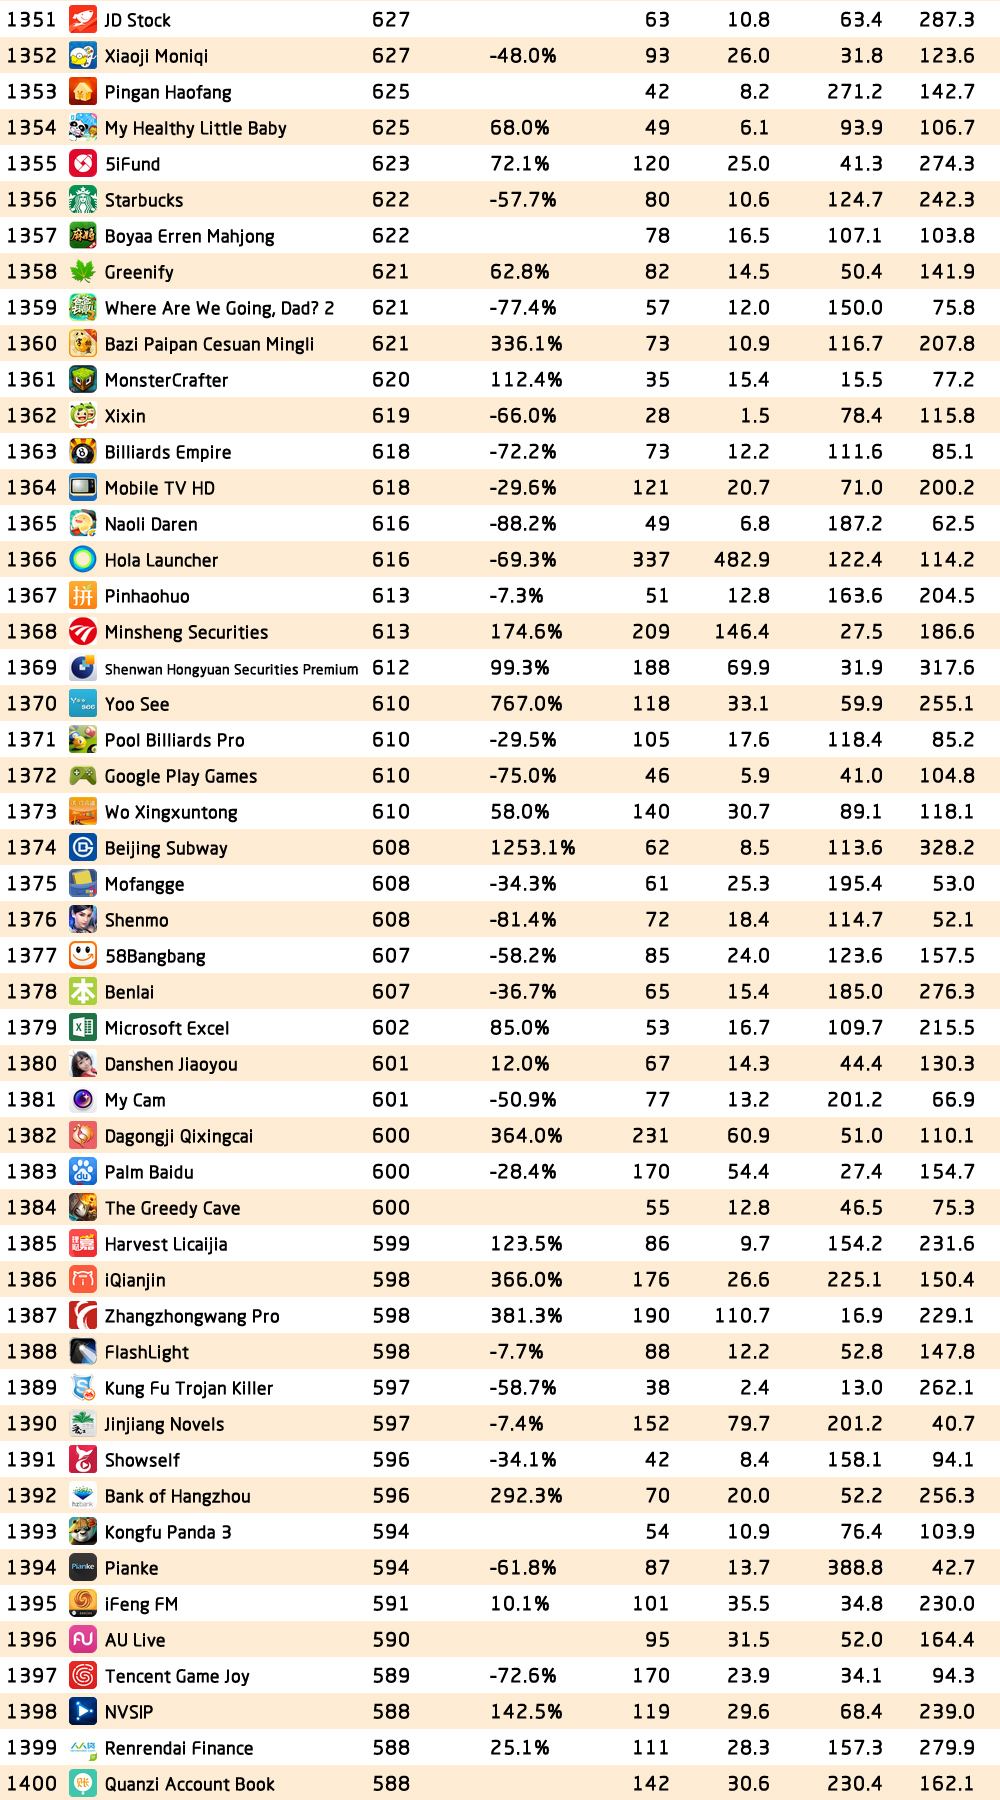
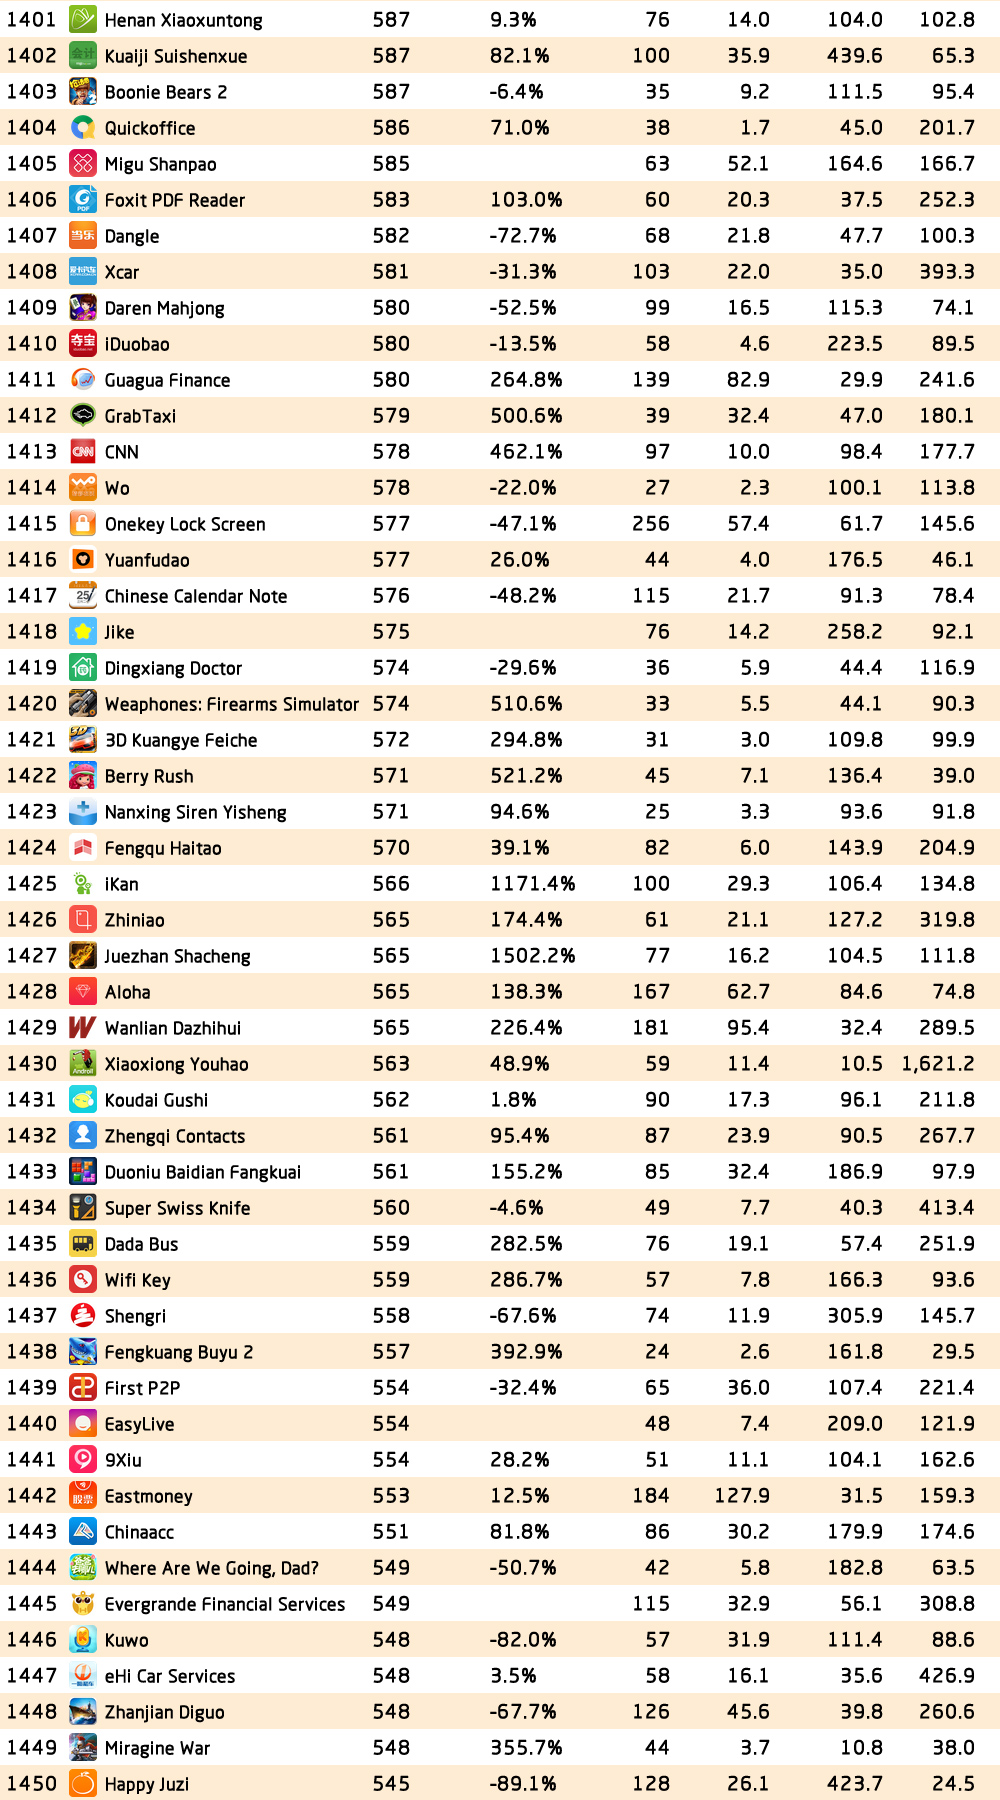
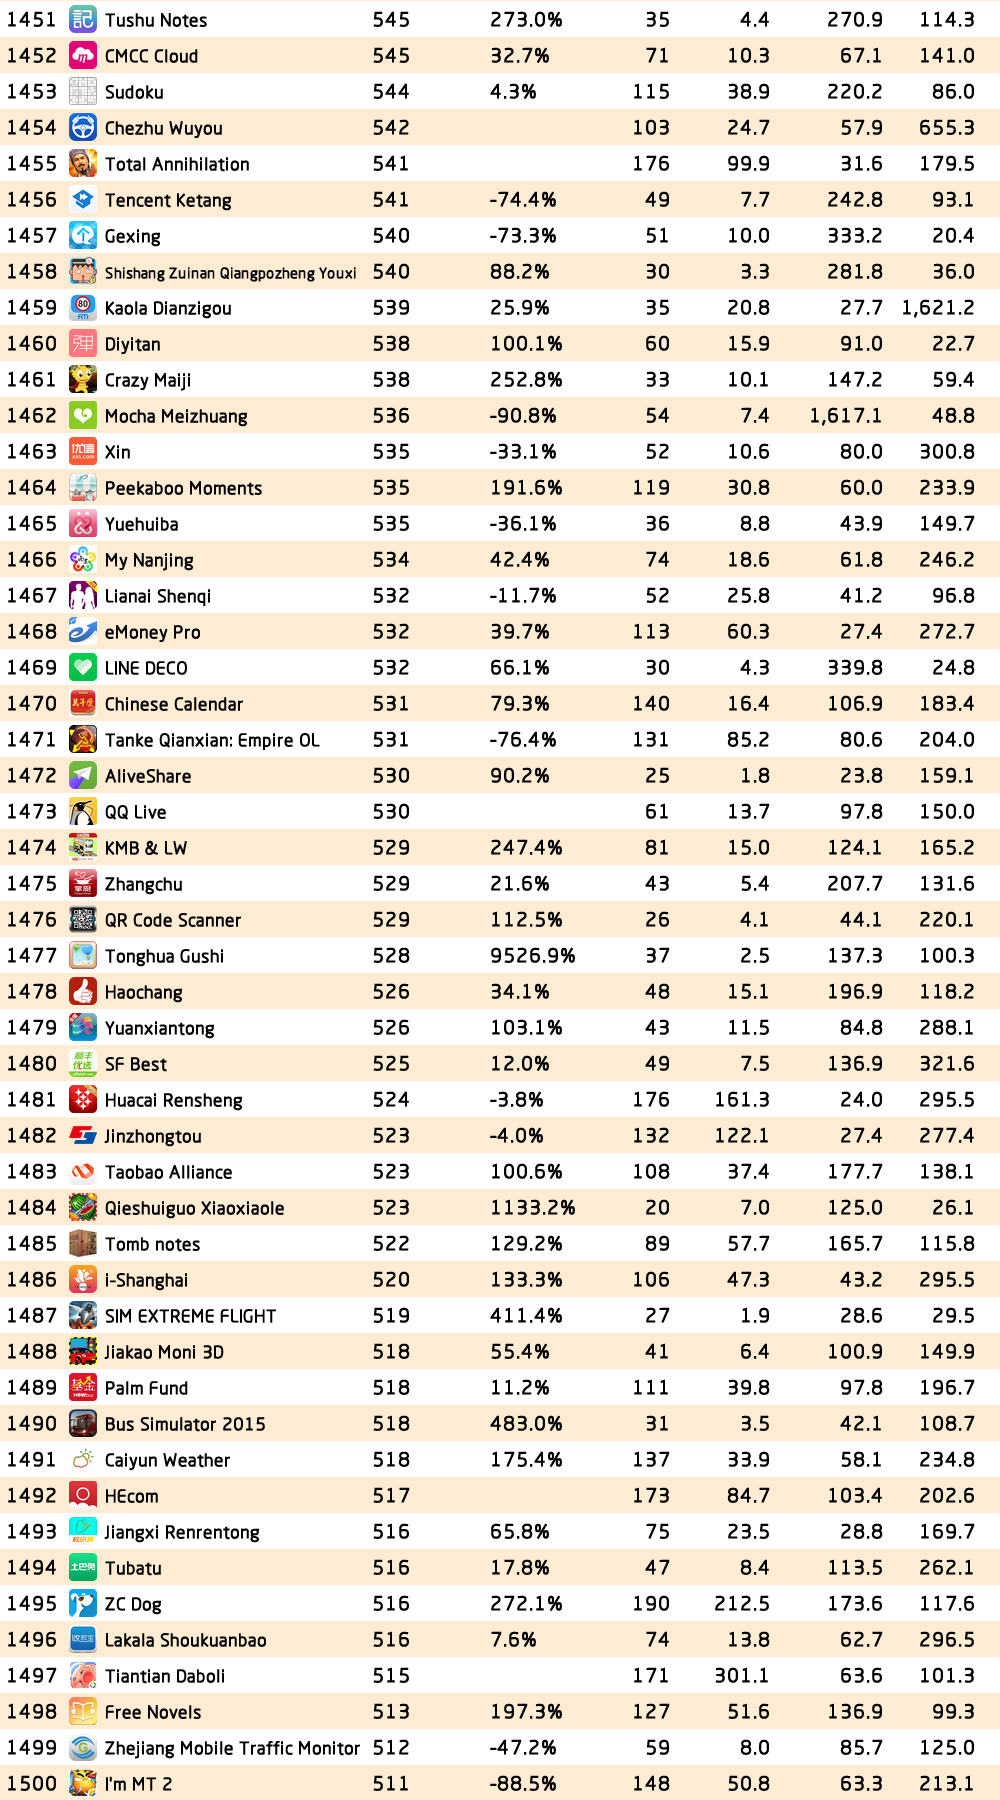
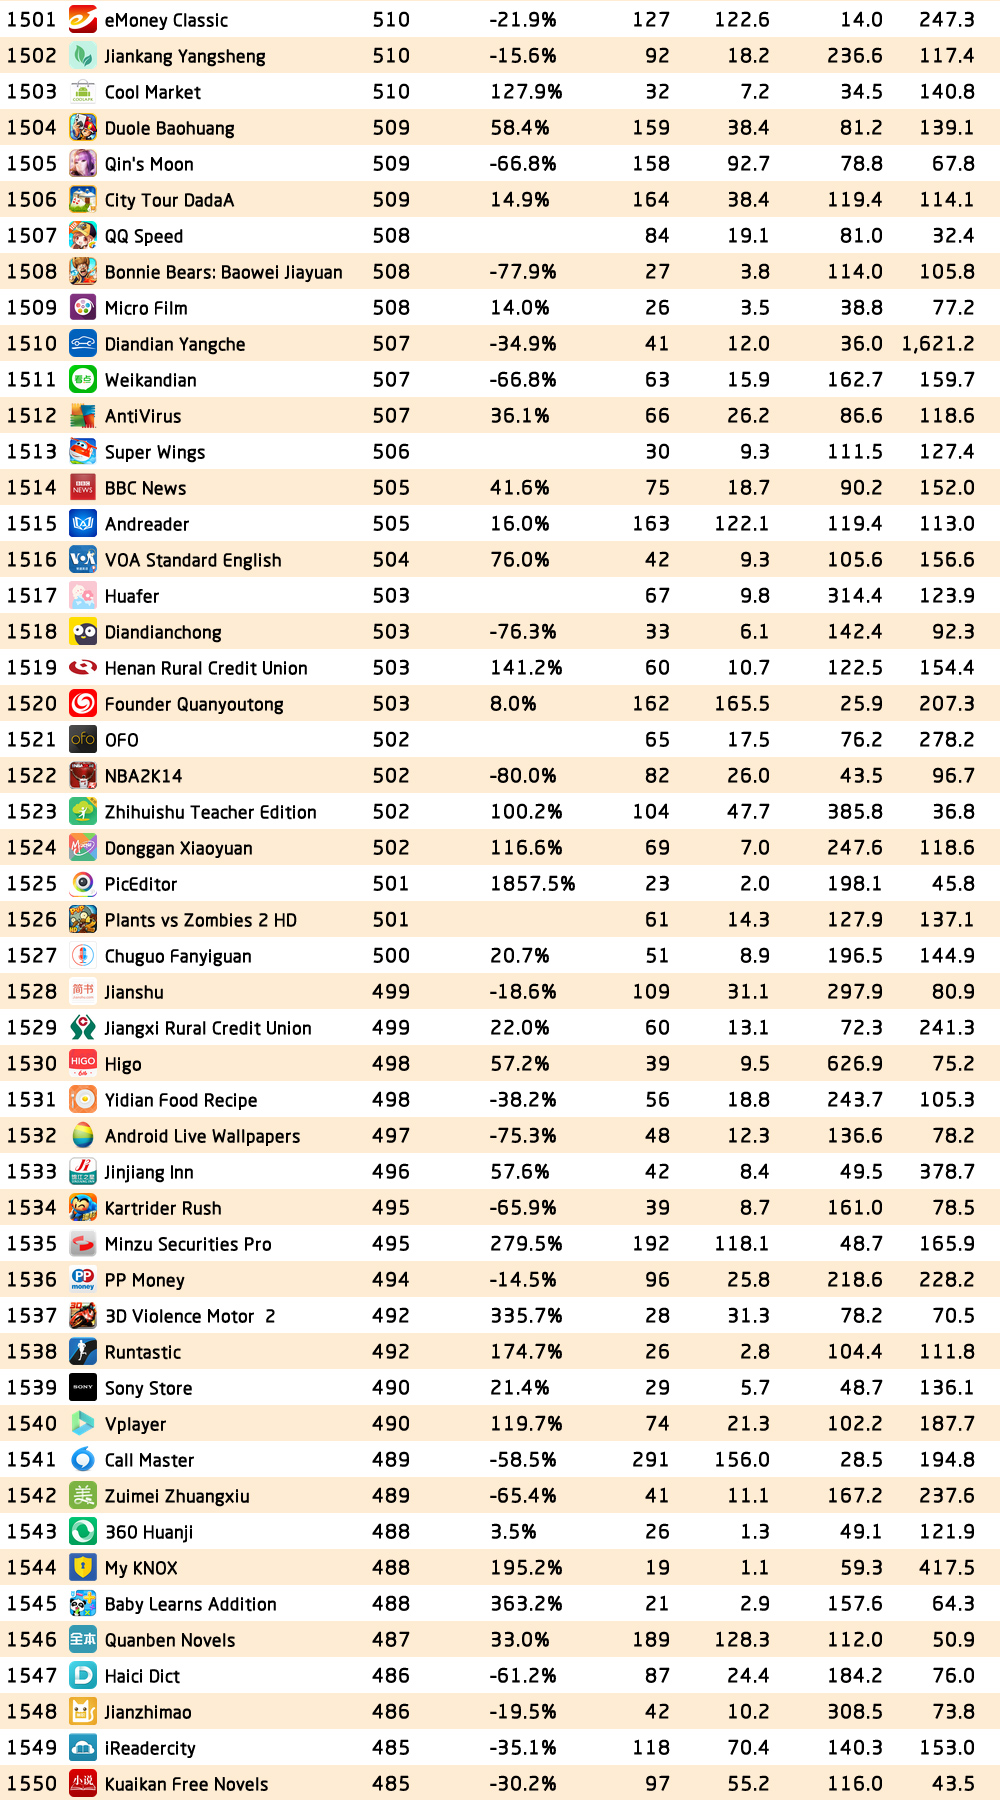
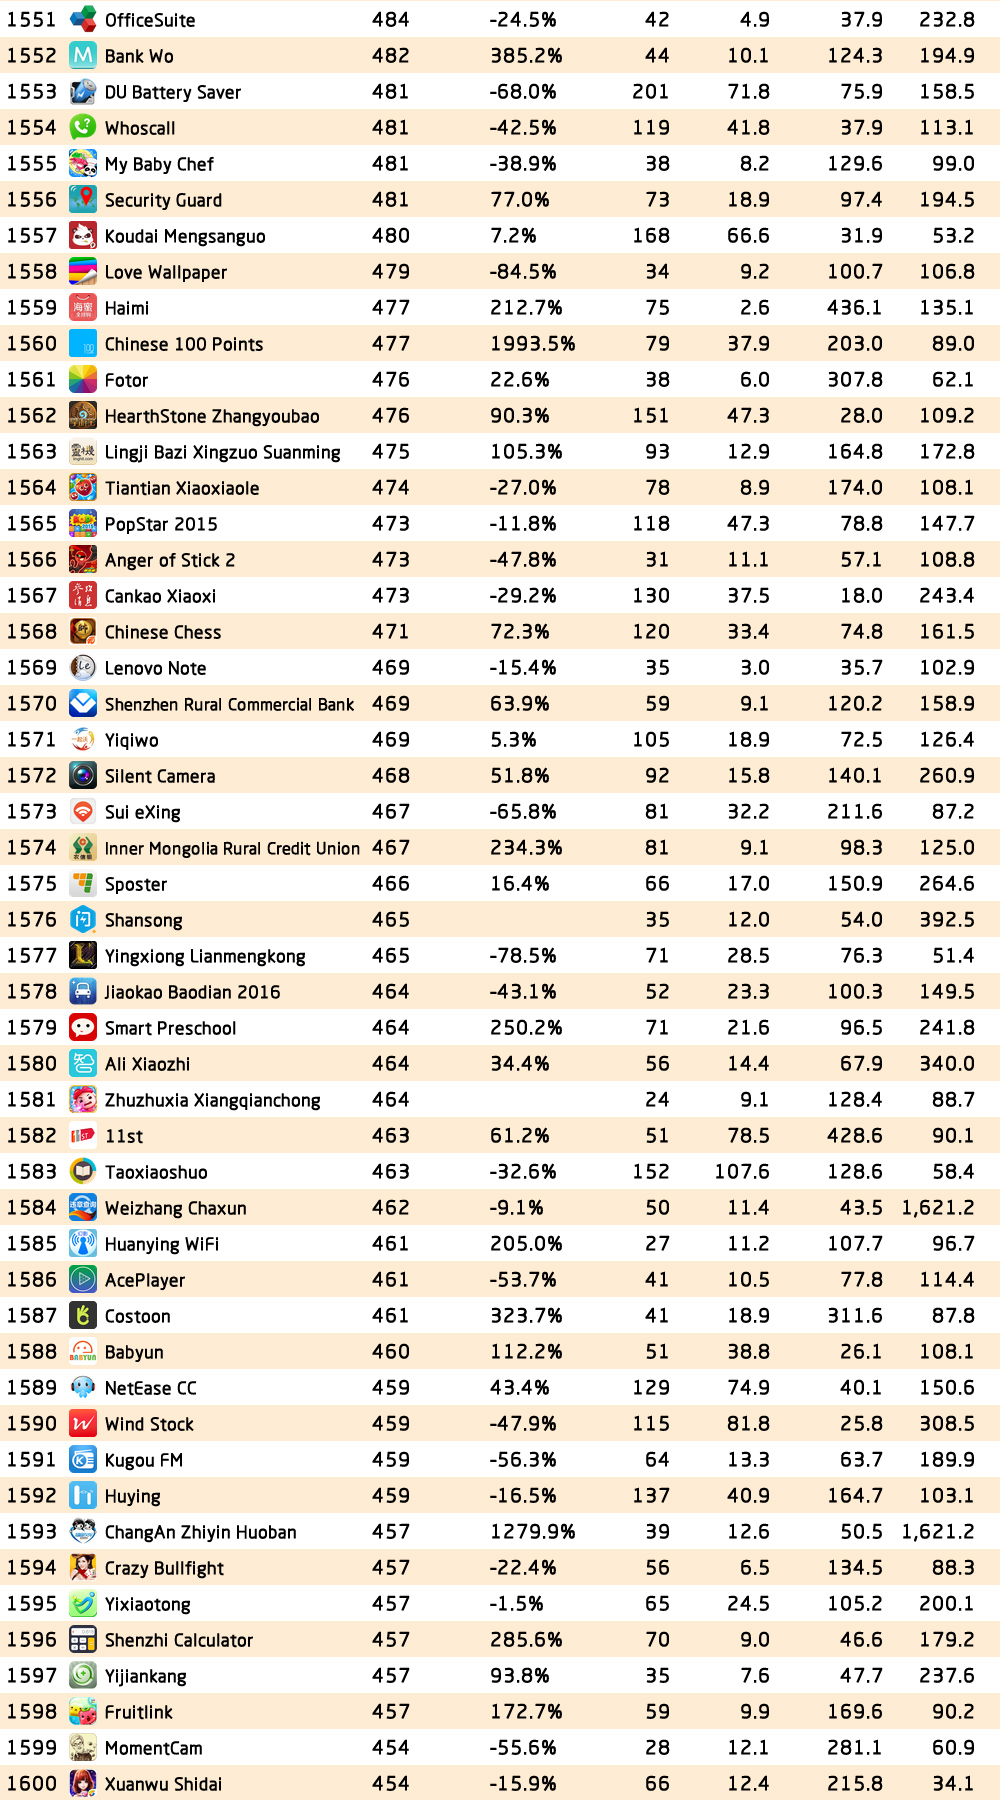
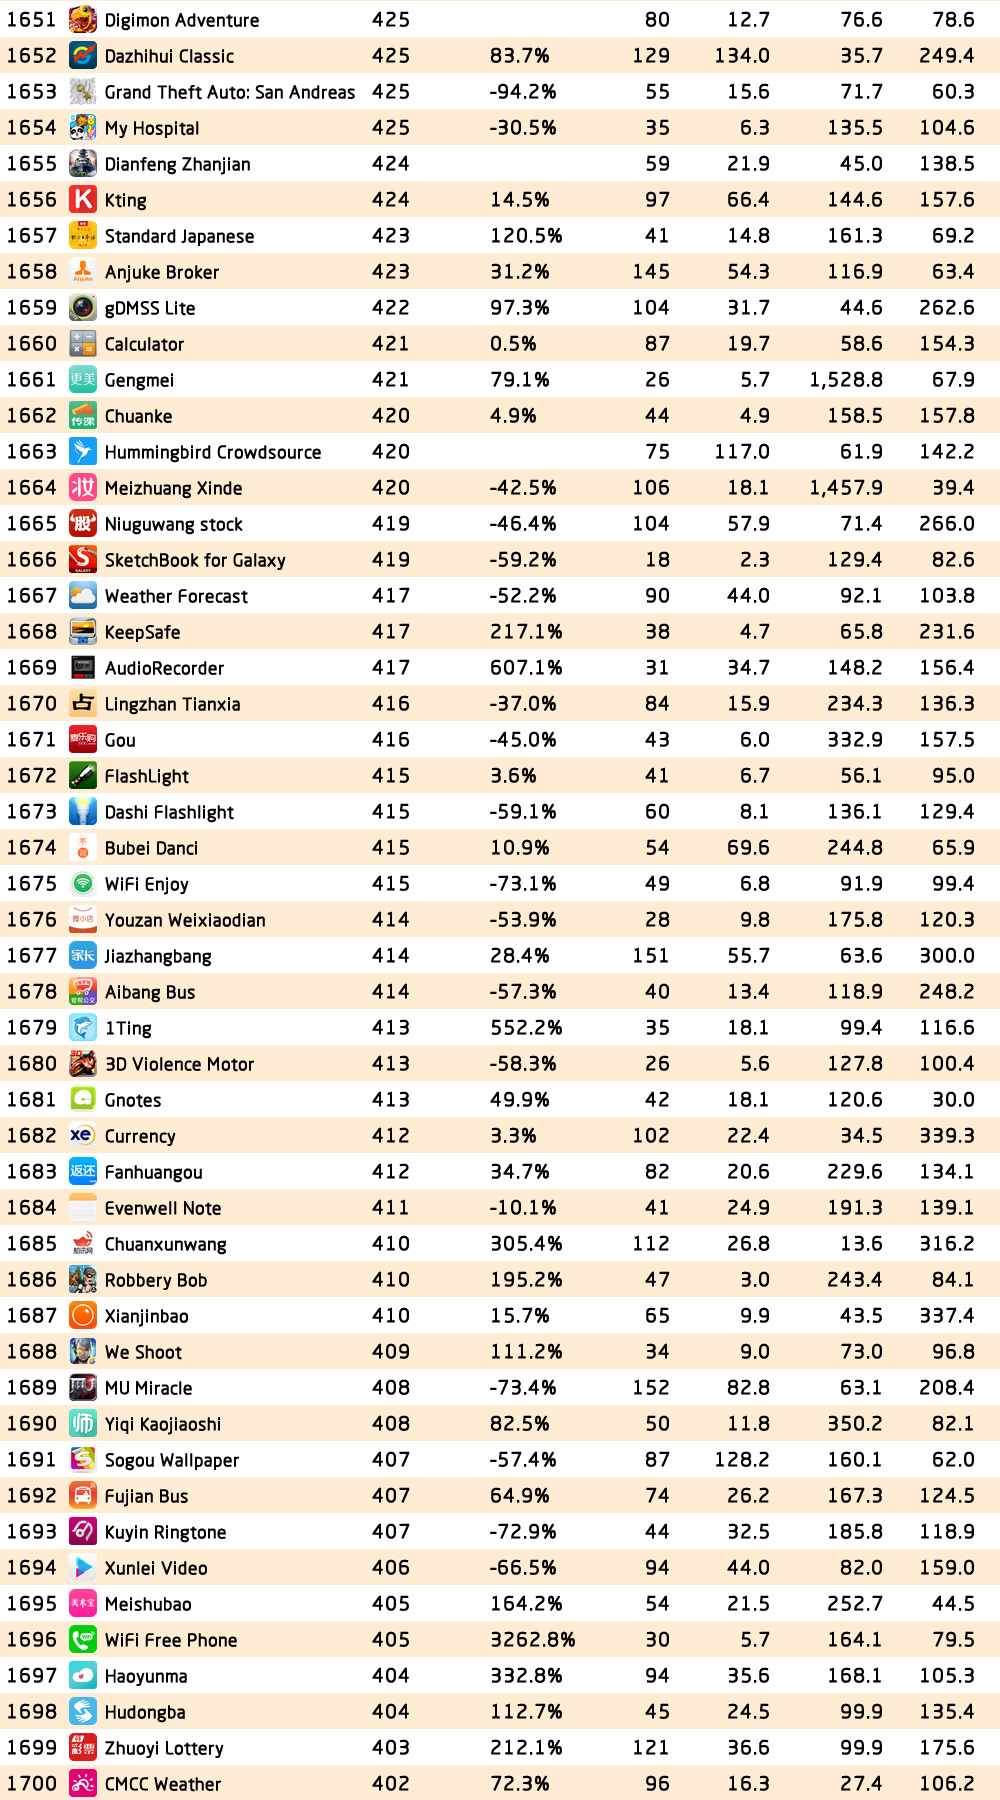
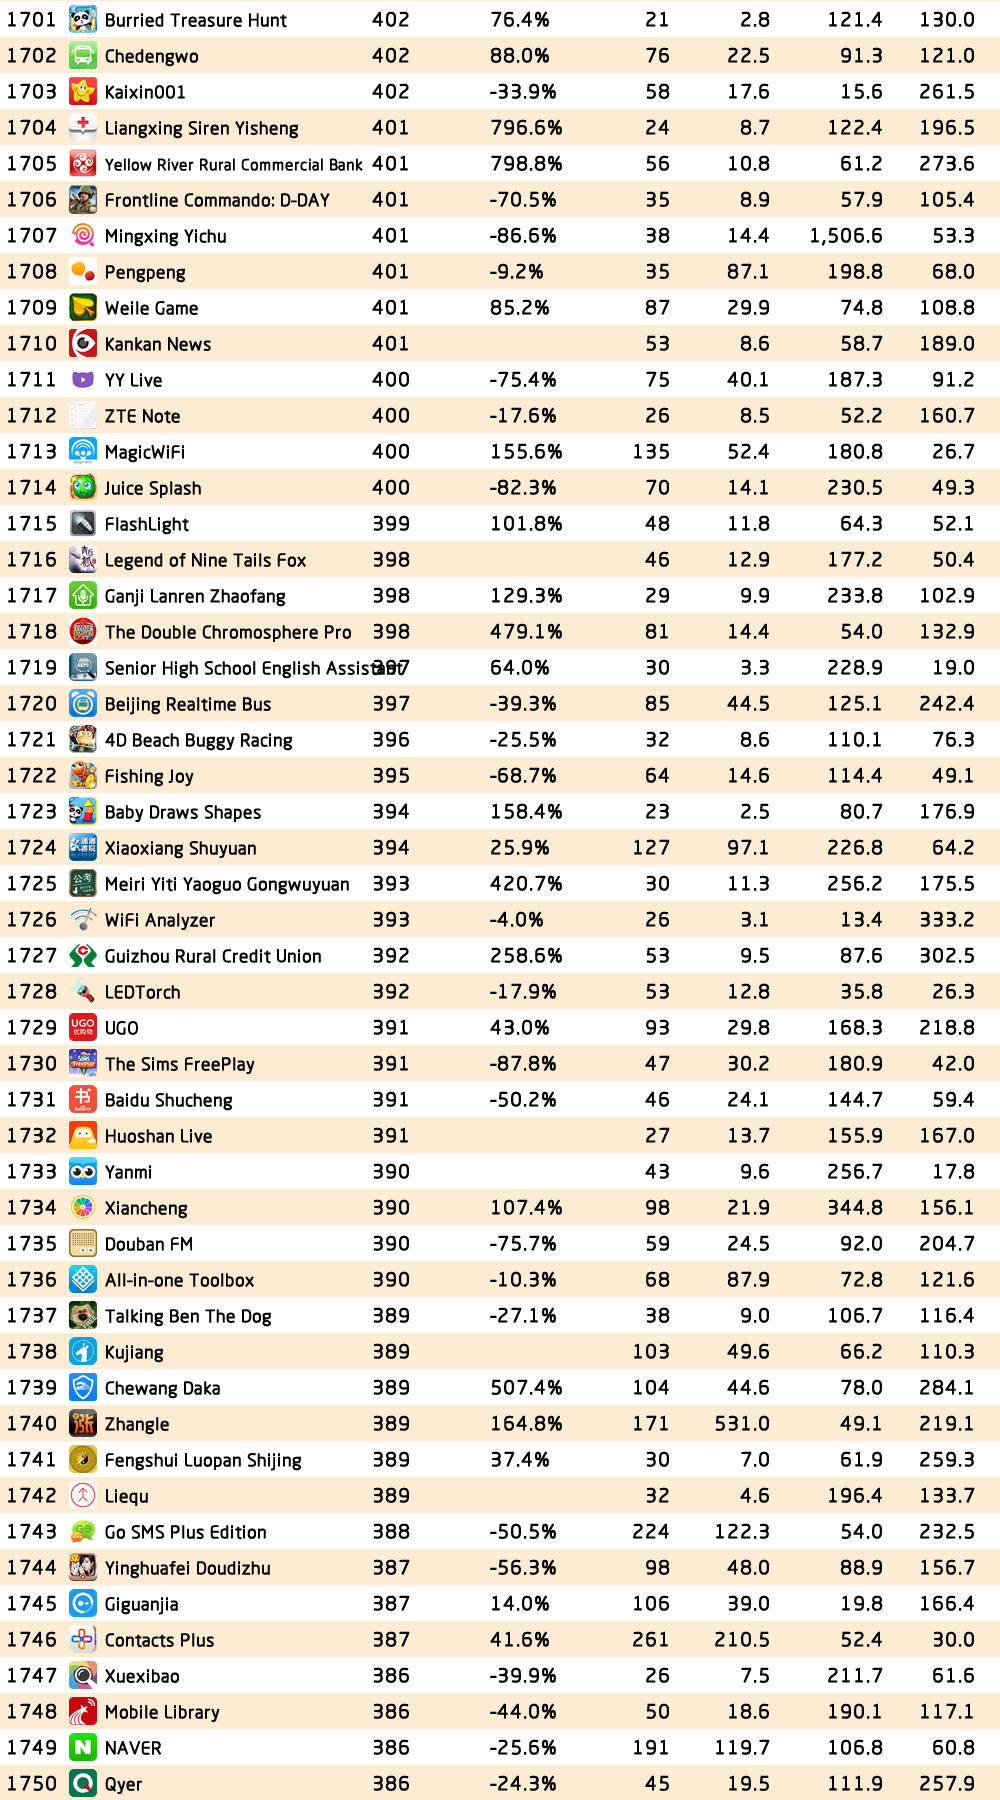
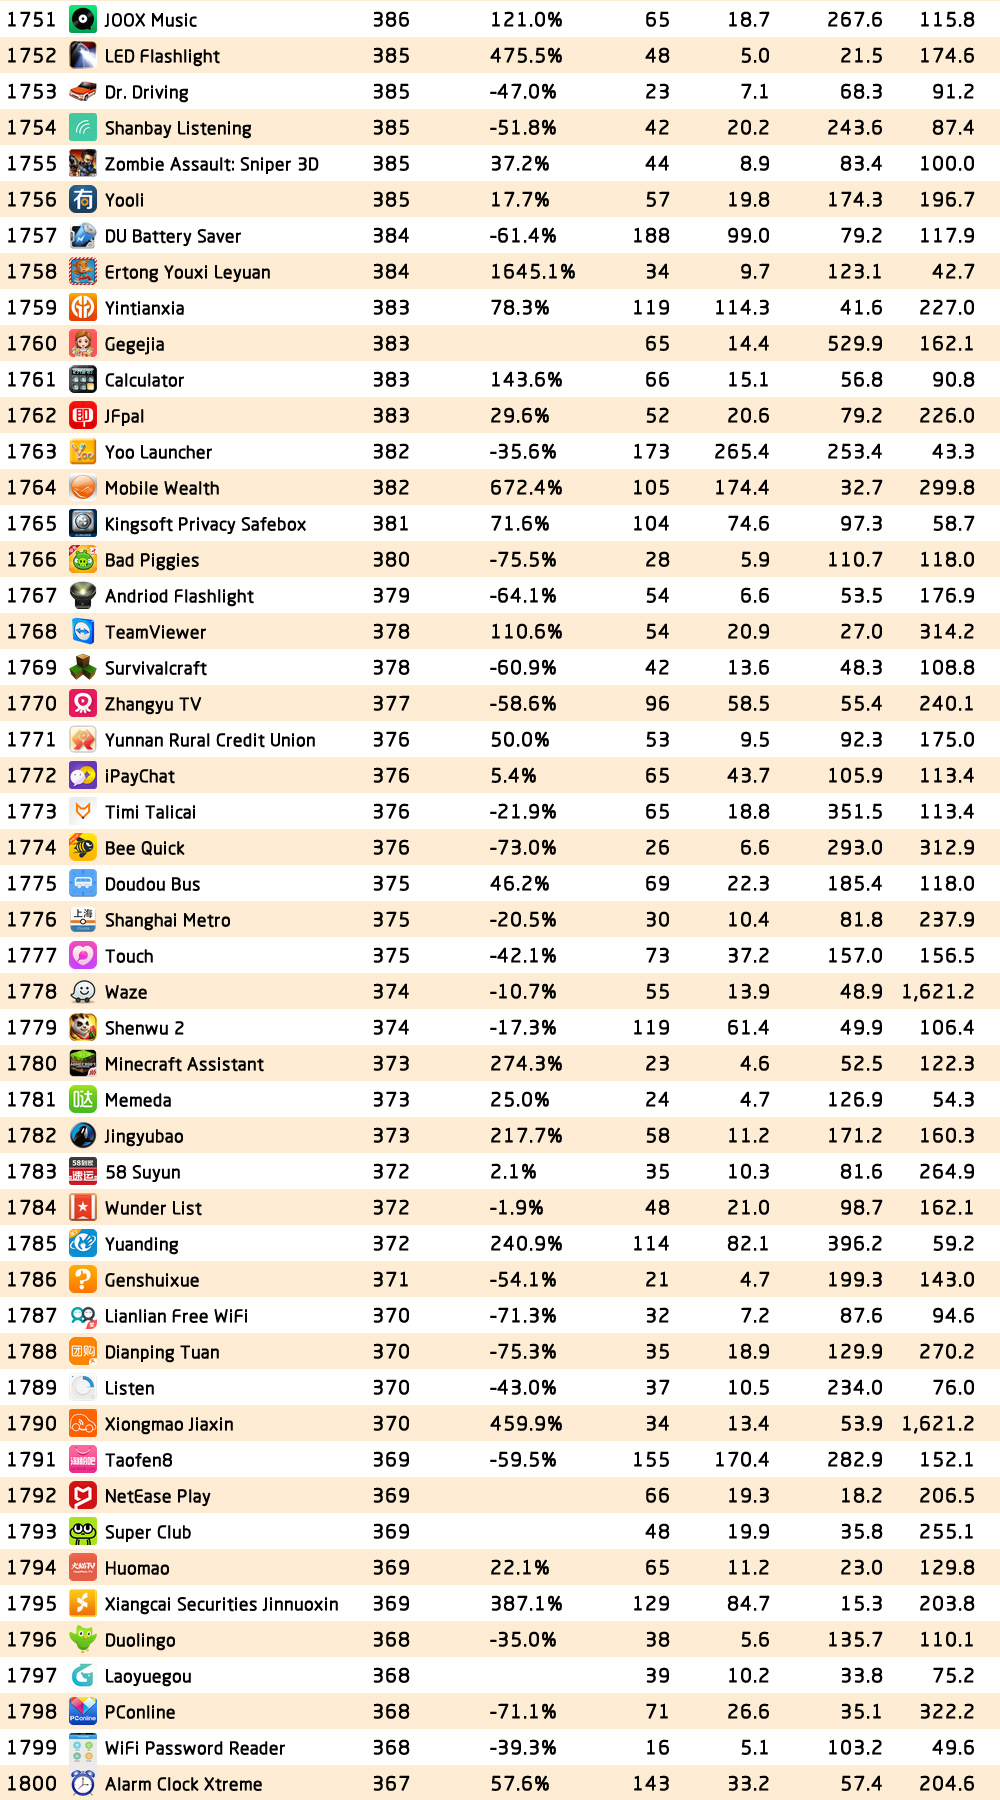
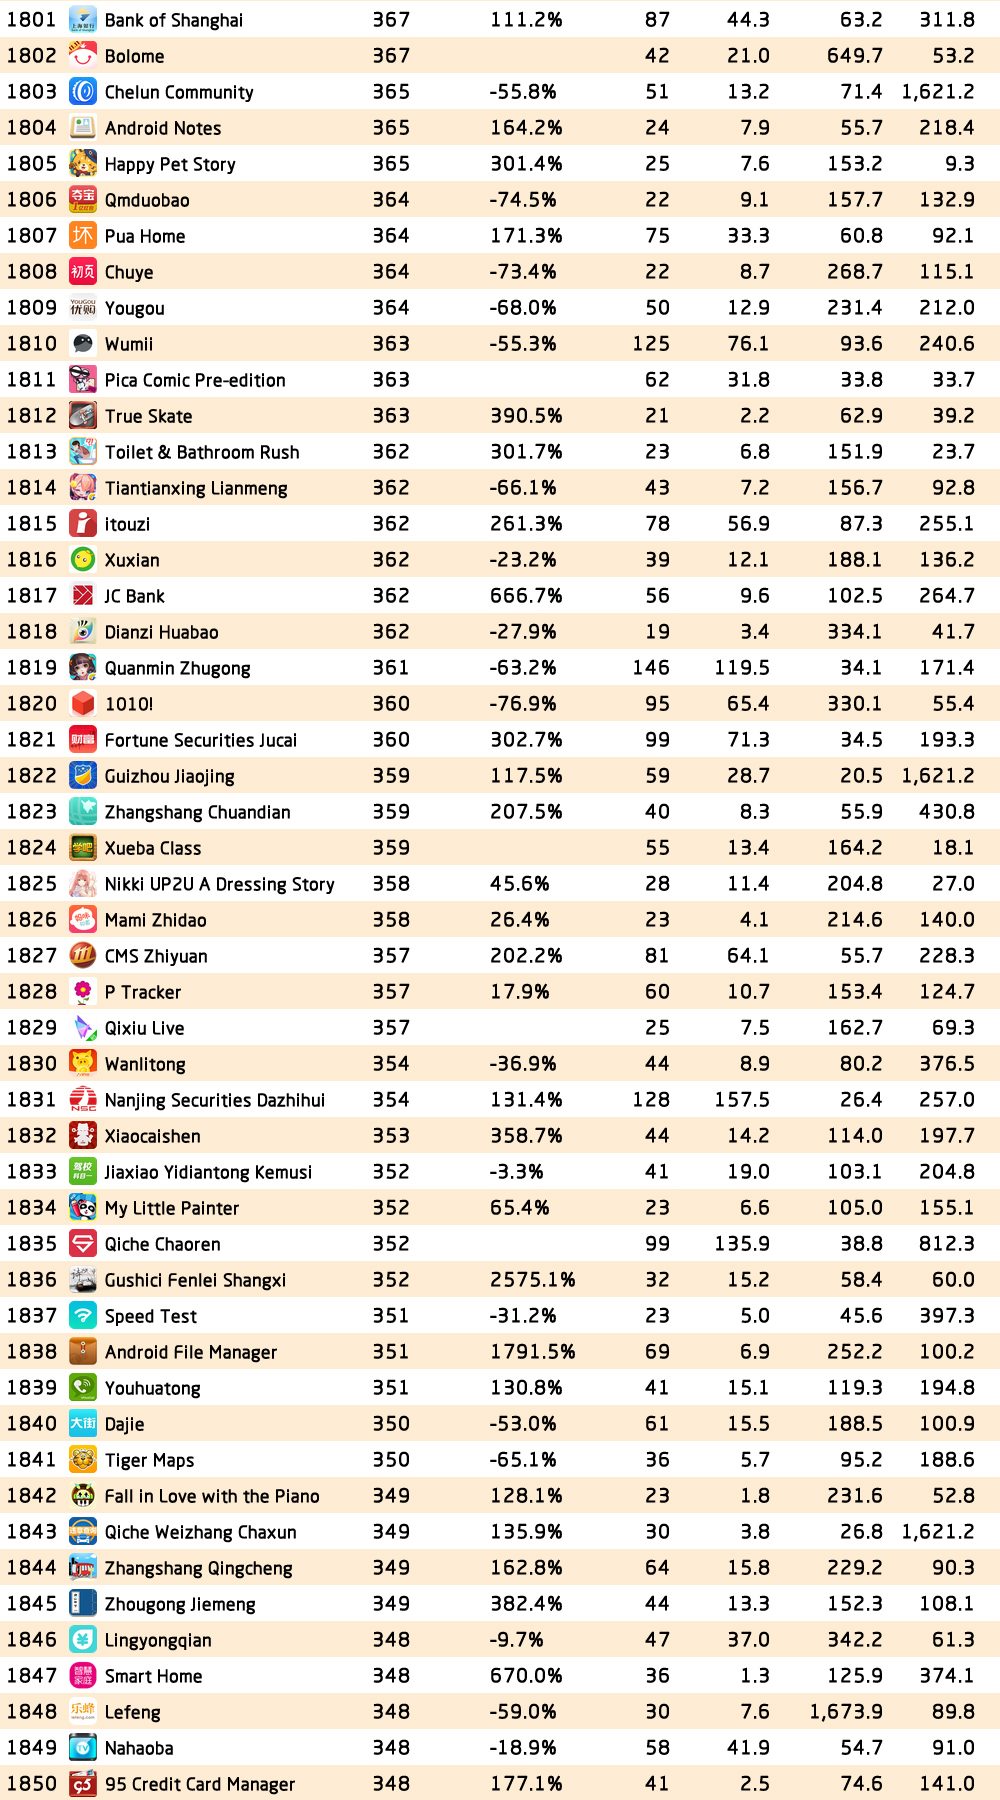
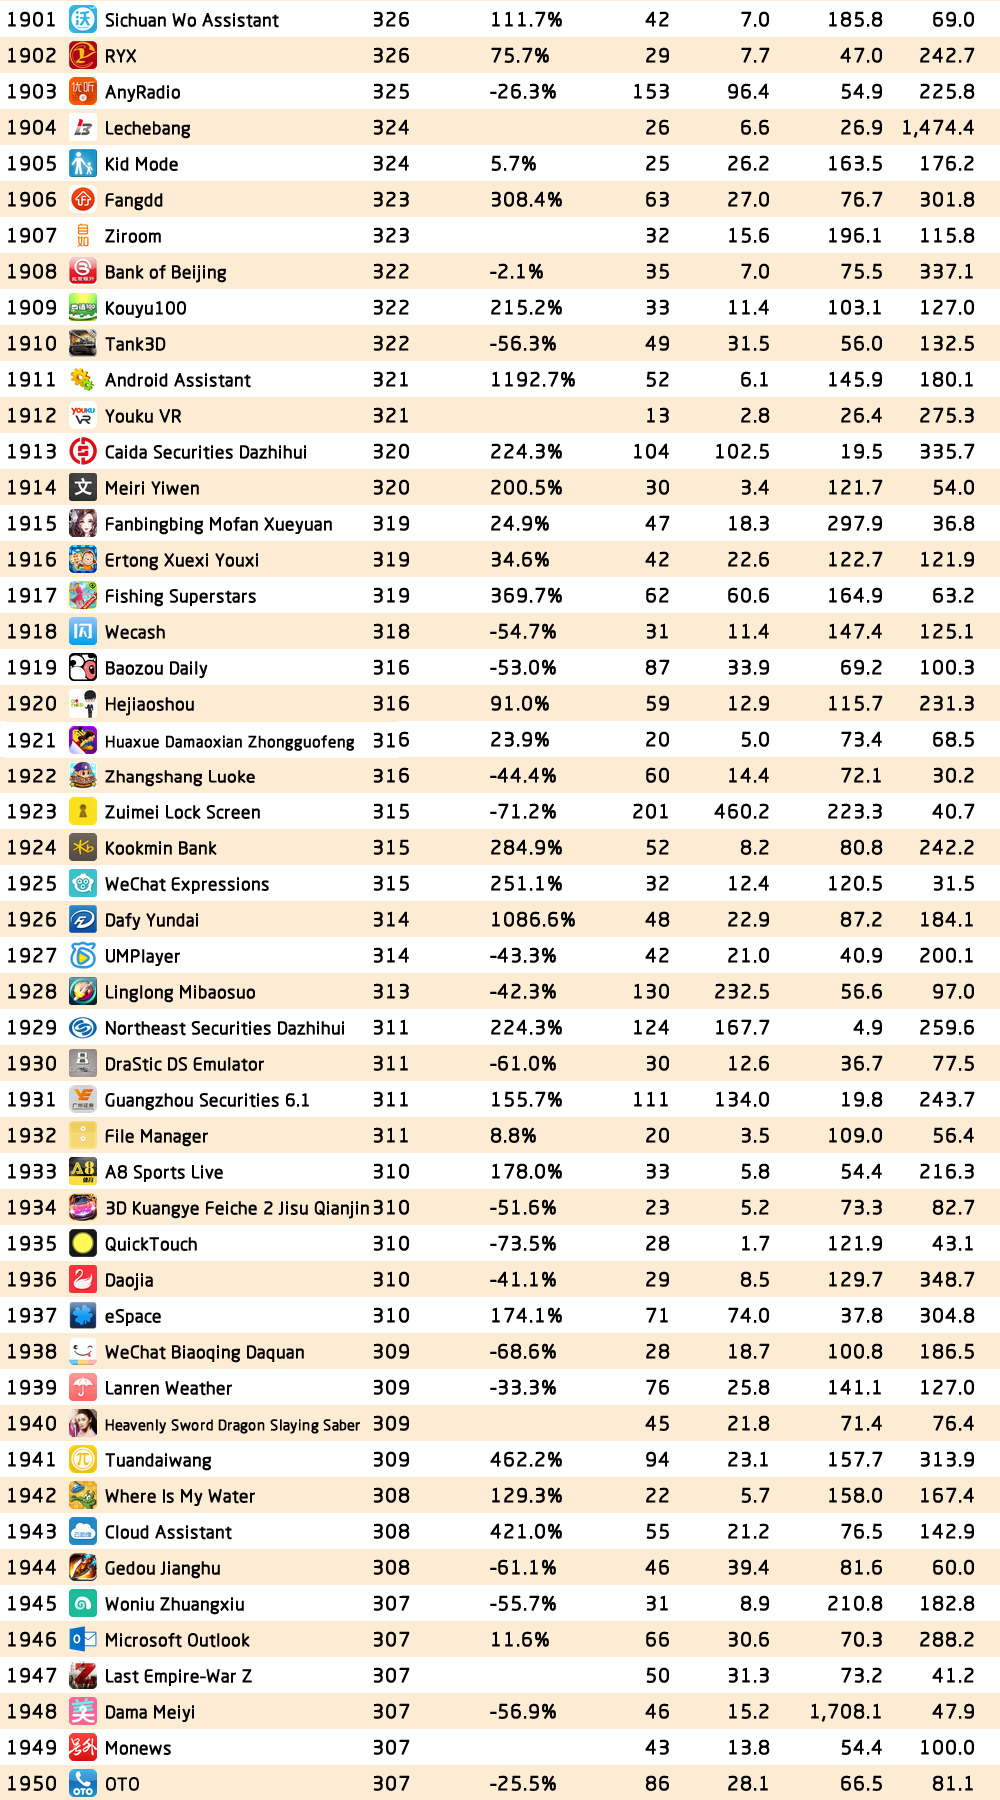
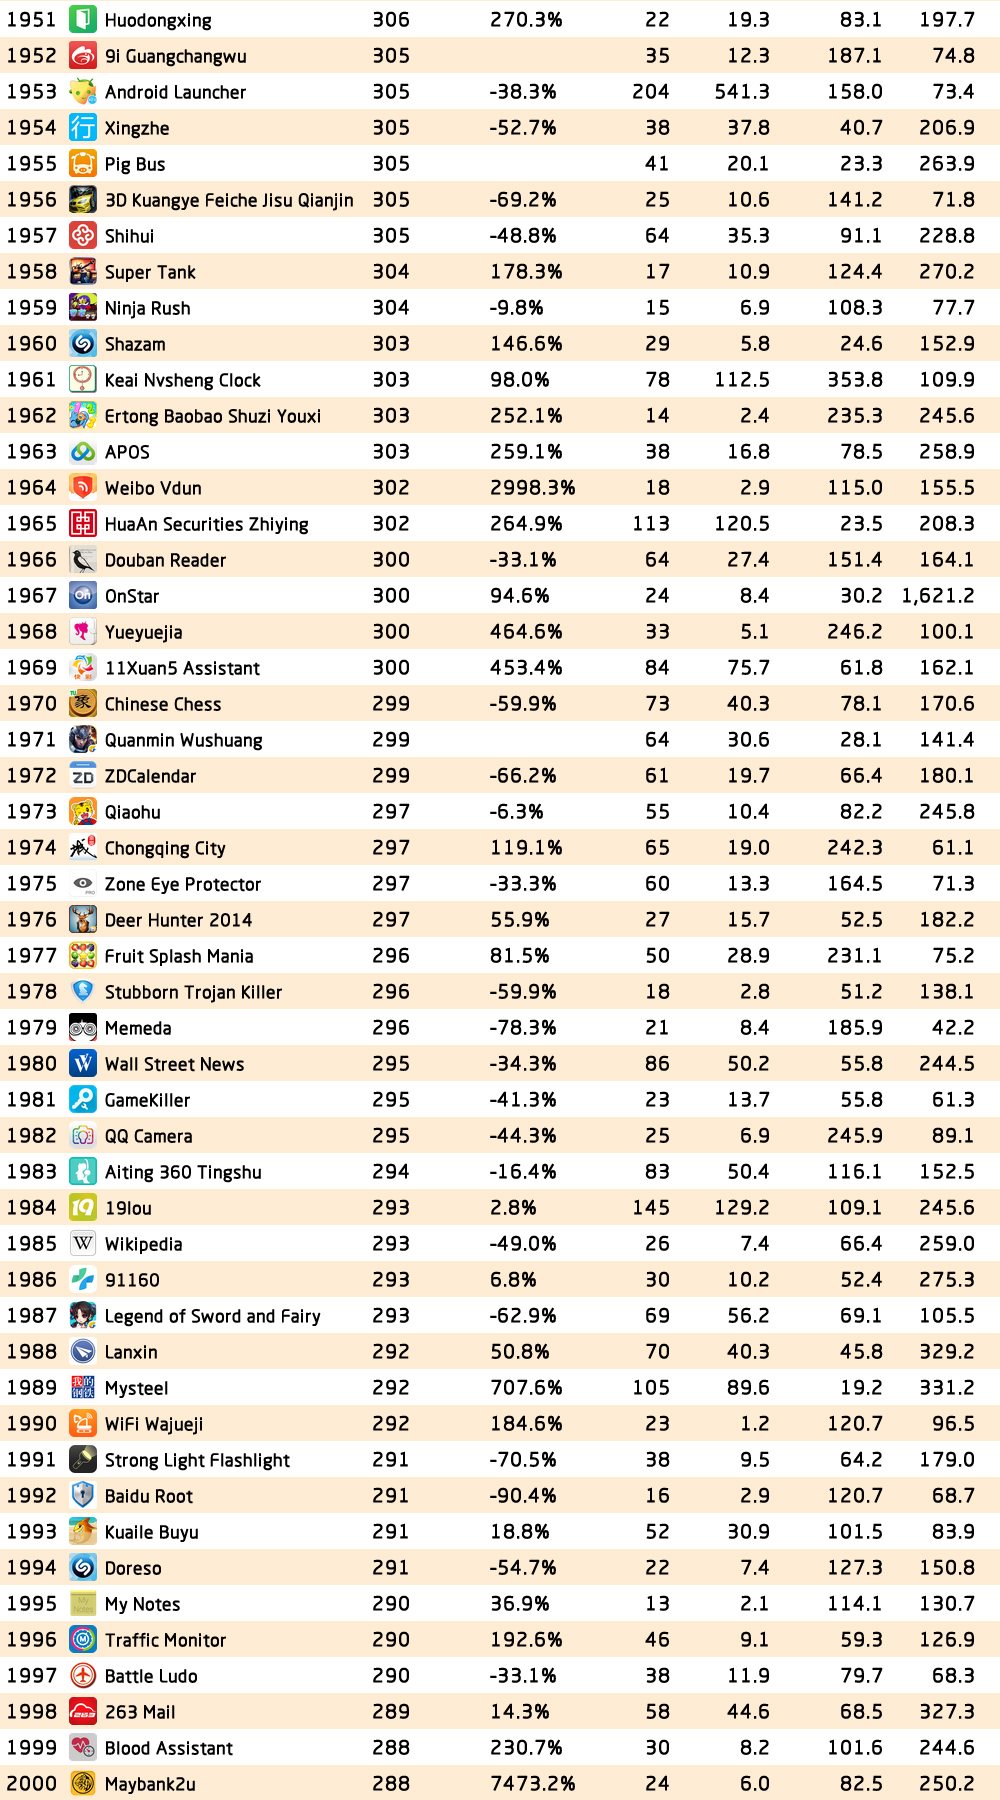
In July, we released unprecedented Top 1000 Chinese Apps which gives a market scan of China’s mobile internet industry. Our peers soon followed suit. Therefore, this time, we take a further step and present you the Top 2000 Chinese Apps which fishes out almost all noticeable players in the market.
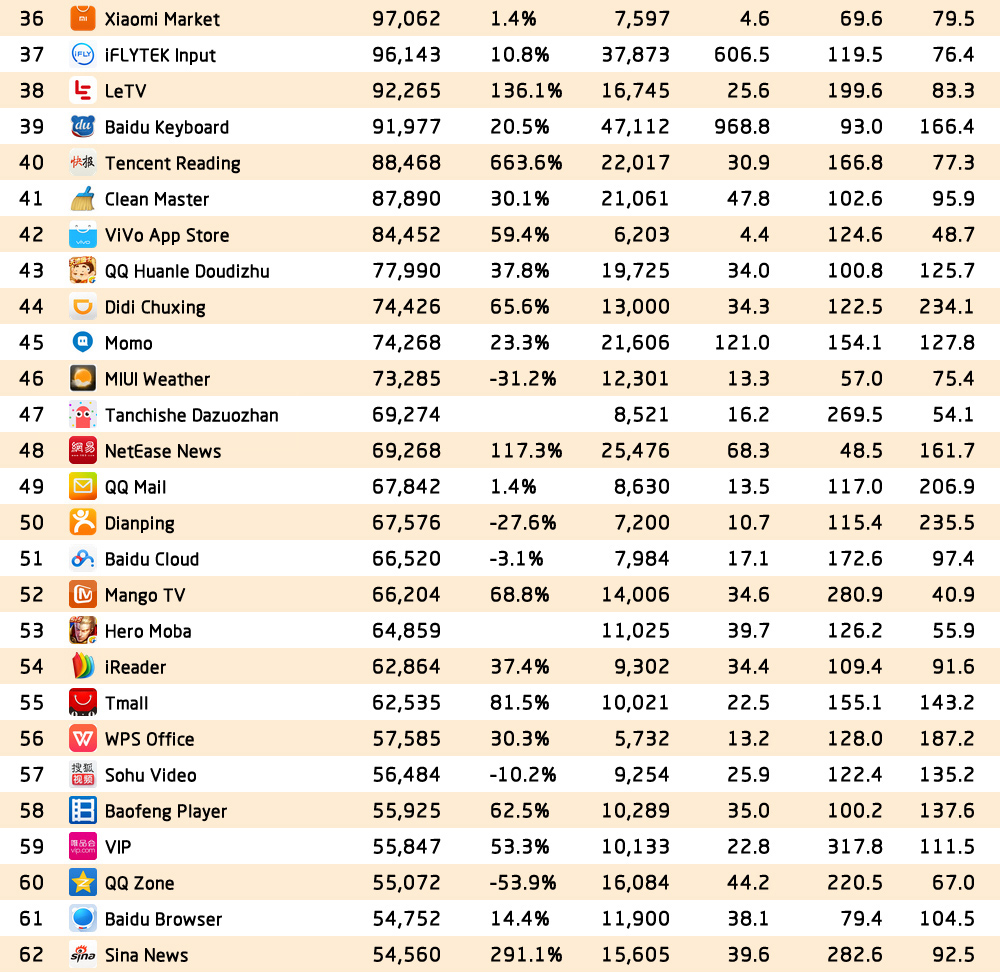
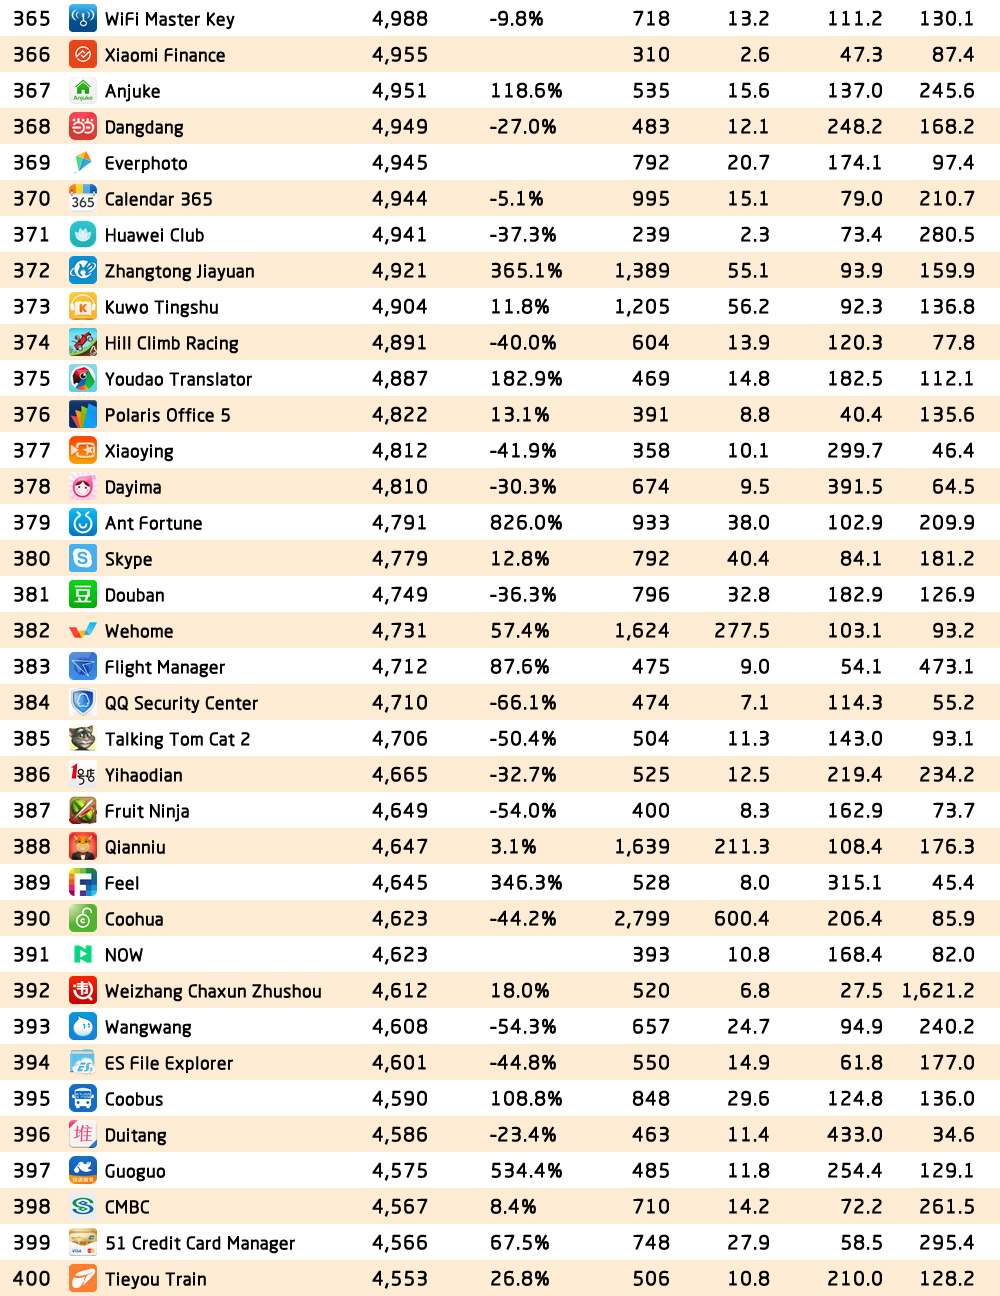
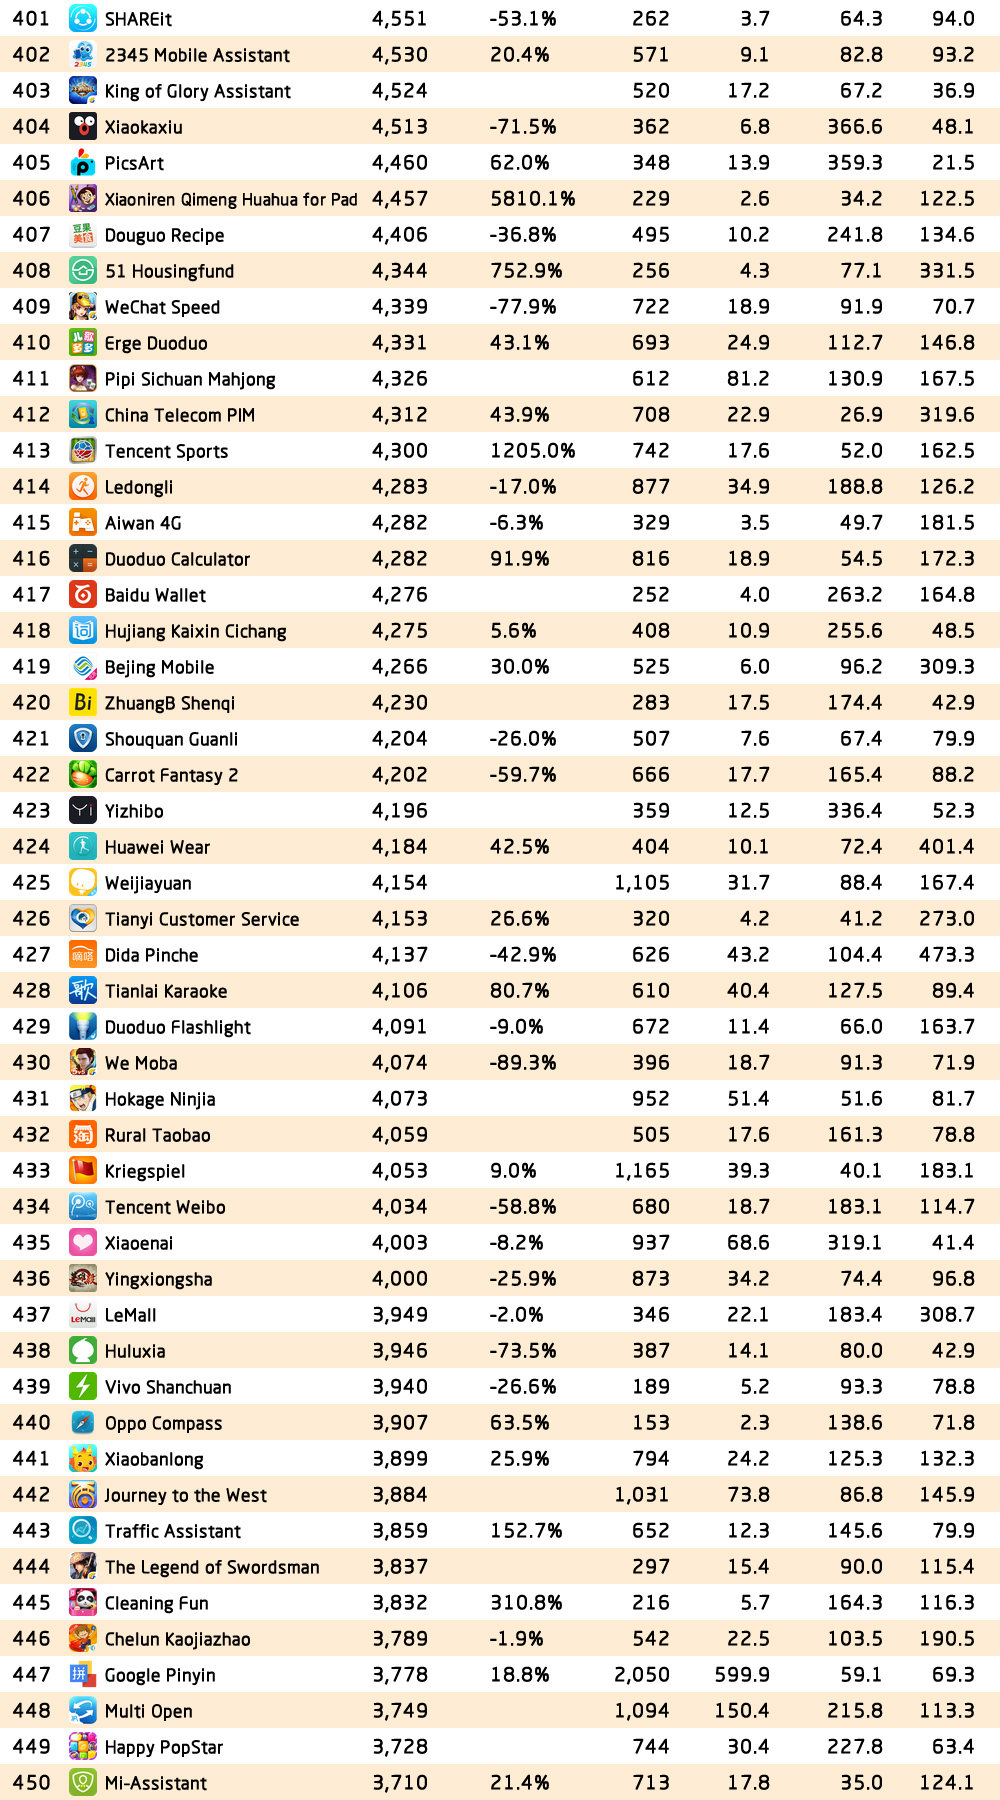
The app rankings includes indices like MAU, DAU, YoY MAU growth, monthly sessions per user, TGI among fashion lovers and car owners. It allows you to keep abreast of app performance and trends as well as user engagement in this single list.
Note: TGI among car owners=% of car owners of this app/% of car owners of all smart device users; TGI among fashion lovers=% of fashion lovers of this app/% of fashion lovers of all smart device users.
Here comes the Top 2000 Chinese Apps Rankings.